NINGEN is a “nearshore value-sourcer” created in June 2022. It operates in the outsourced Customer Experience sector. NINGEN specializes in the innovation and digitalization of the Customer Experience.
NINGEN positions itself as a global operator that supports companies in the implementation, optimization and transformation of their customer base.
The usability tests so far showed some significant results internally and with prospects externally, while paving the way to checking our next business goals.
Here is a breakdown of the real-world metrics that were extracted so far.
87%
Increase in demo requests
53
Daily active internal users
92%
Retained clients
46%
Increase in market exposure
Timeline
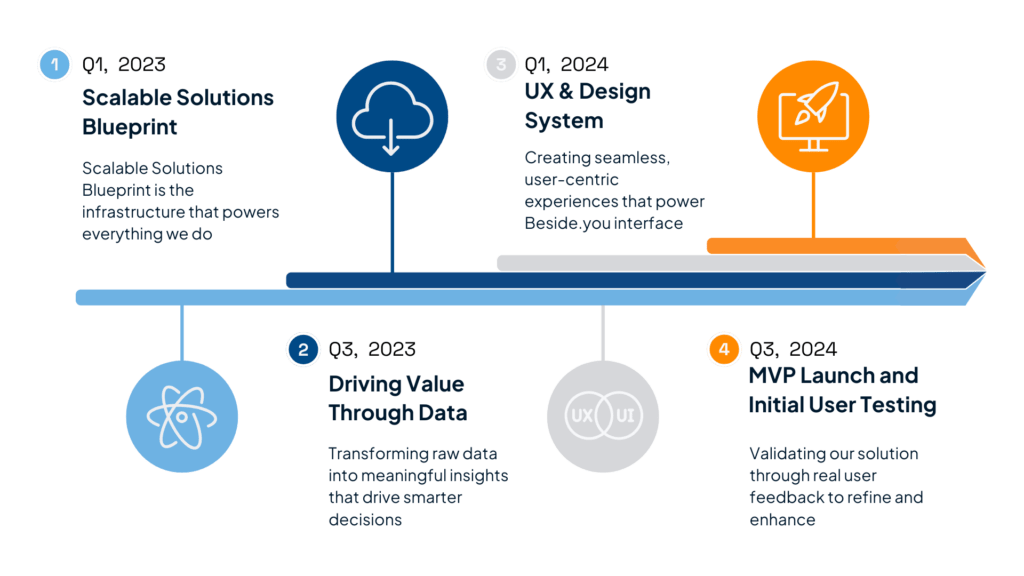
The team initially focused on laying the ideal foundation and environment plus the data science working behind the scenes meanwhile I started laying the design system, branding and product experience, and then we merged everything and launched, and from there the new phase of the product life began.
How it all started
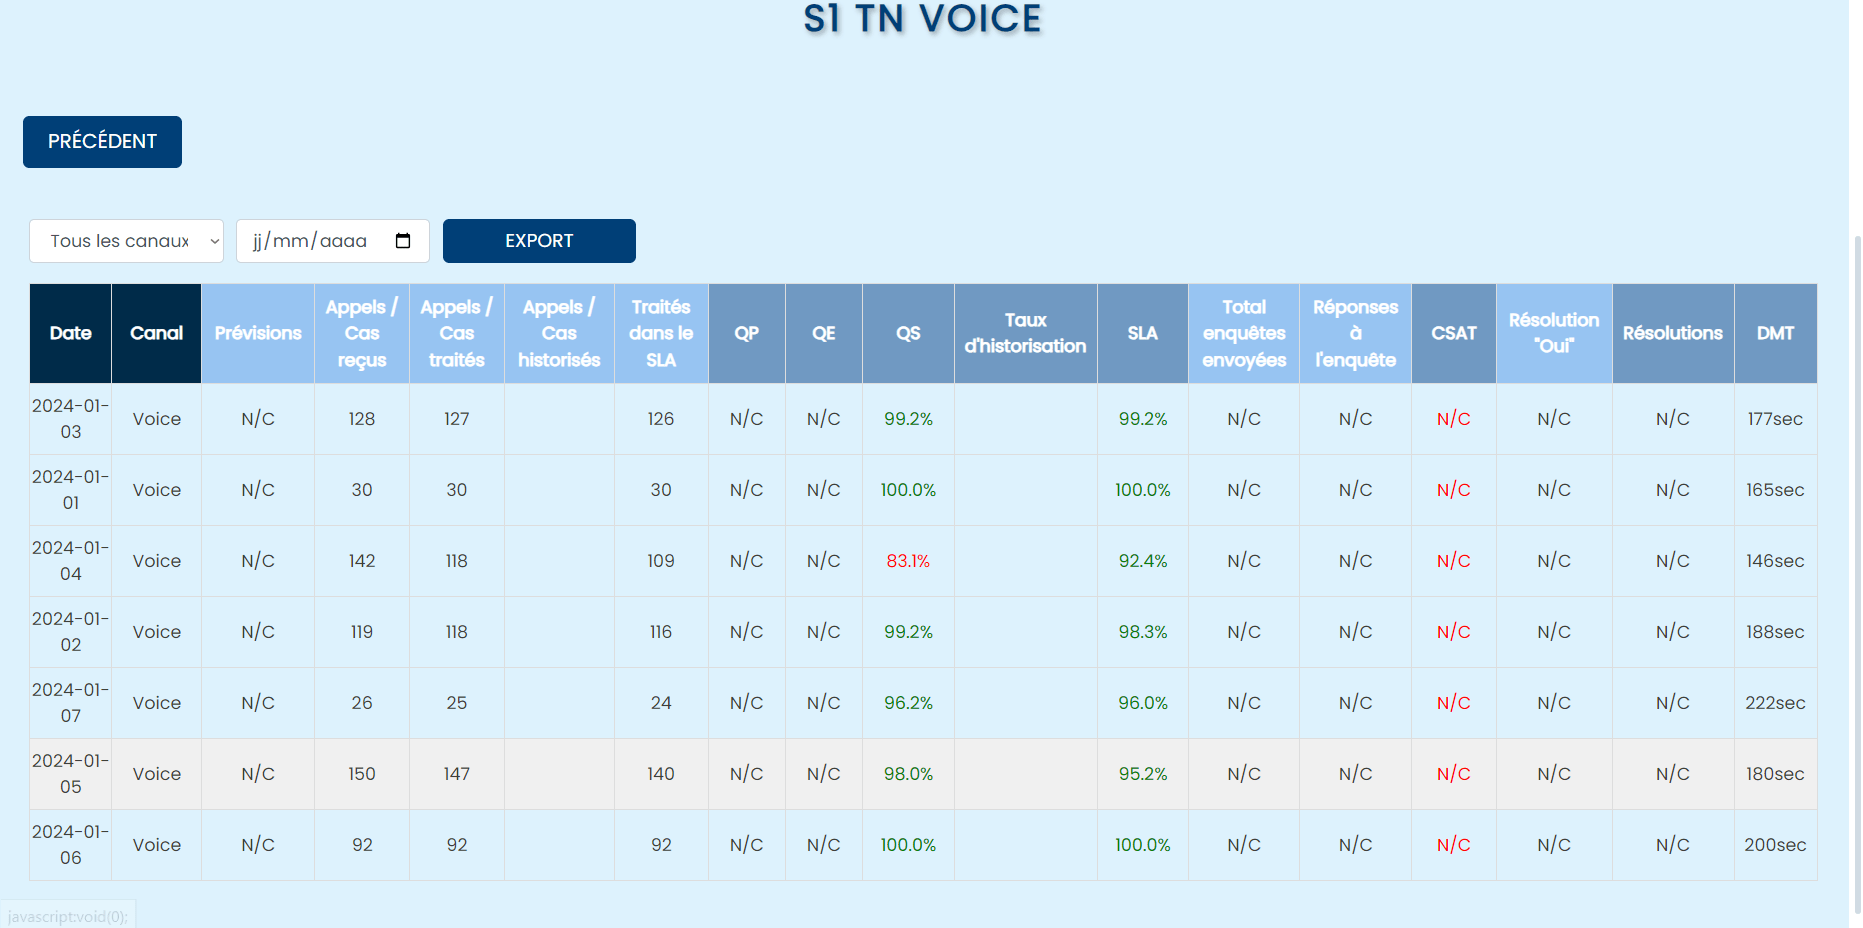
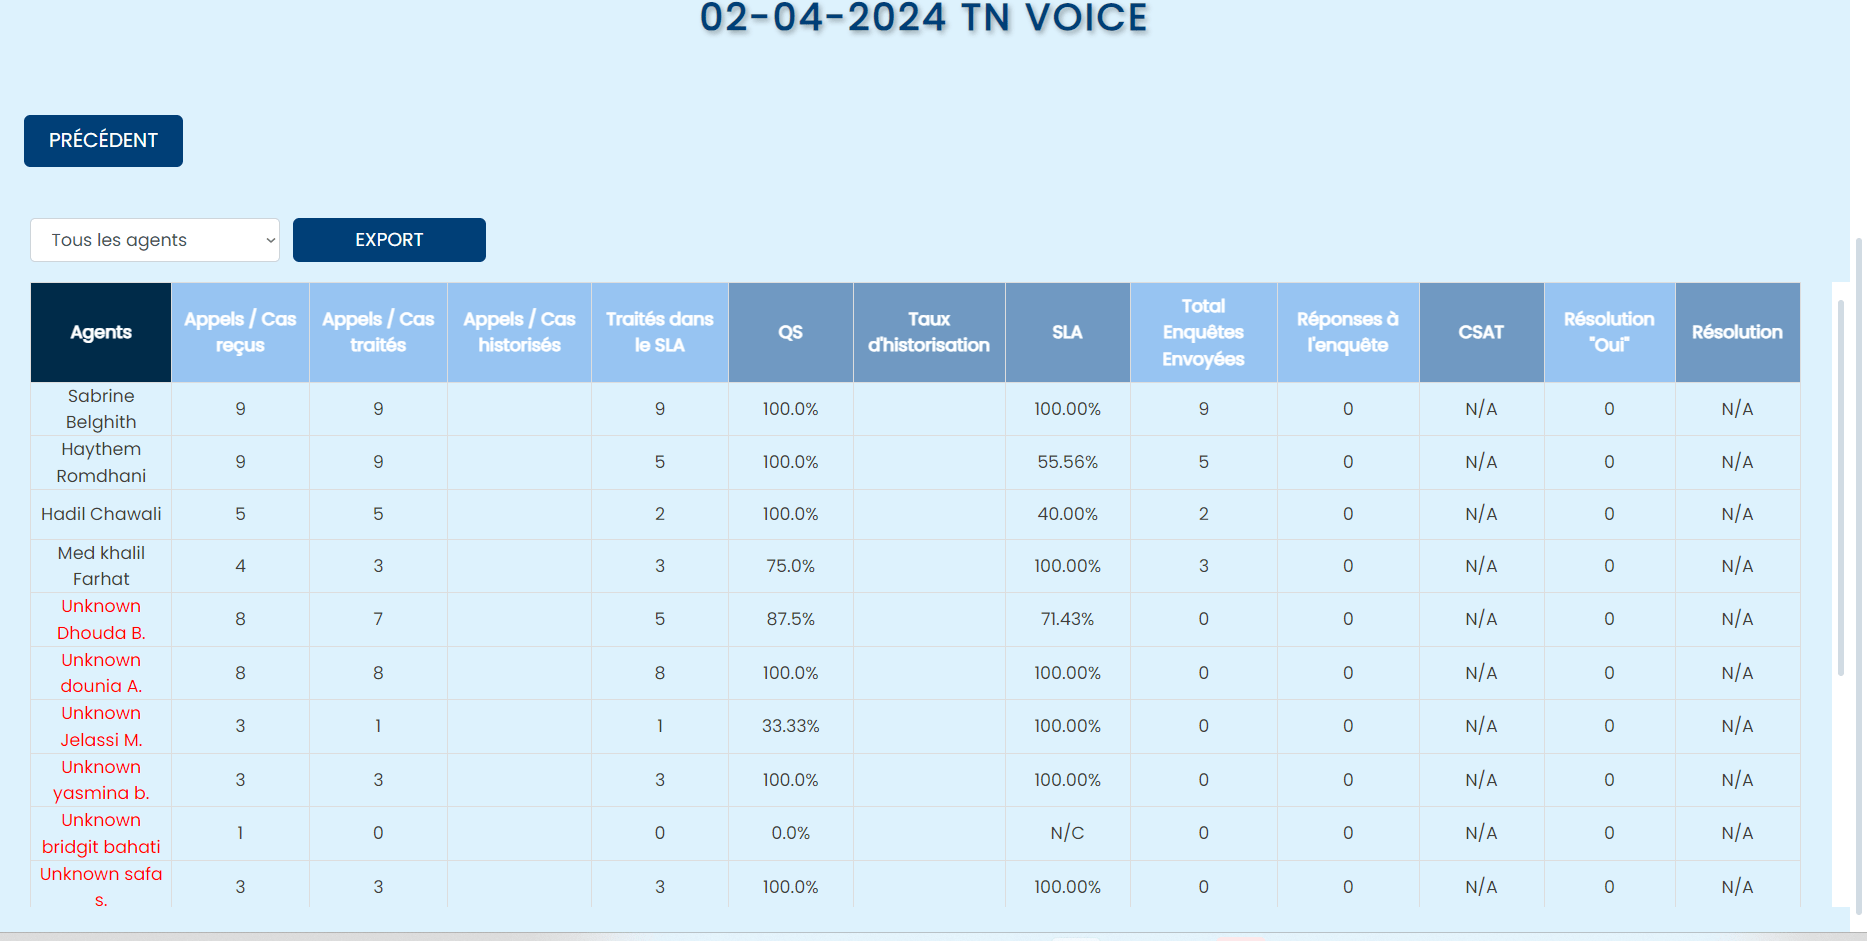
I initially joined Ningen Group as the sole product designer along a small multidisciplinary team of a product manager, data analysts, backend and front devs that worked on the platform for a straight 3 month period just to pull, stack and class data in a way that will make everything foundationally sound before working on anything related to user interface or experience design.
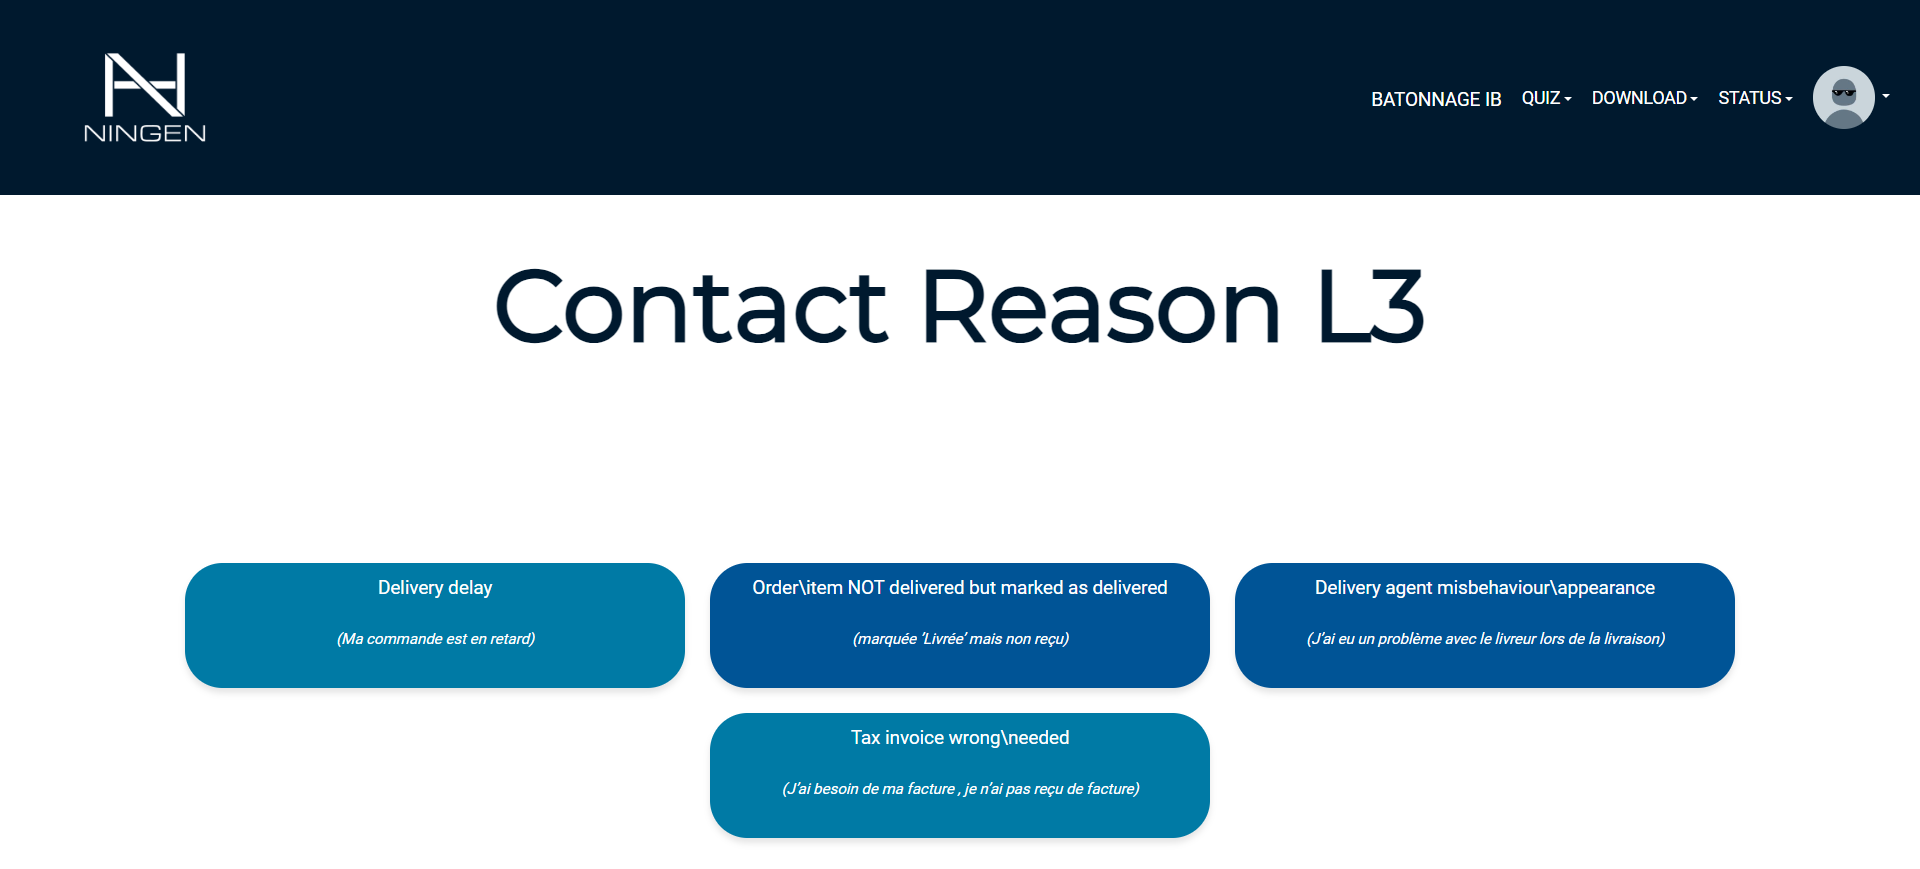
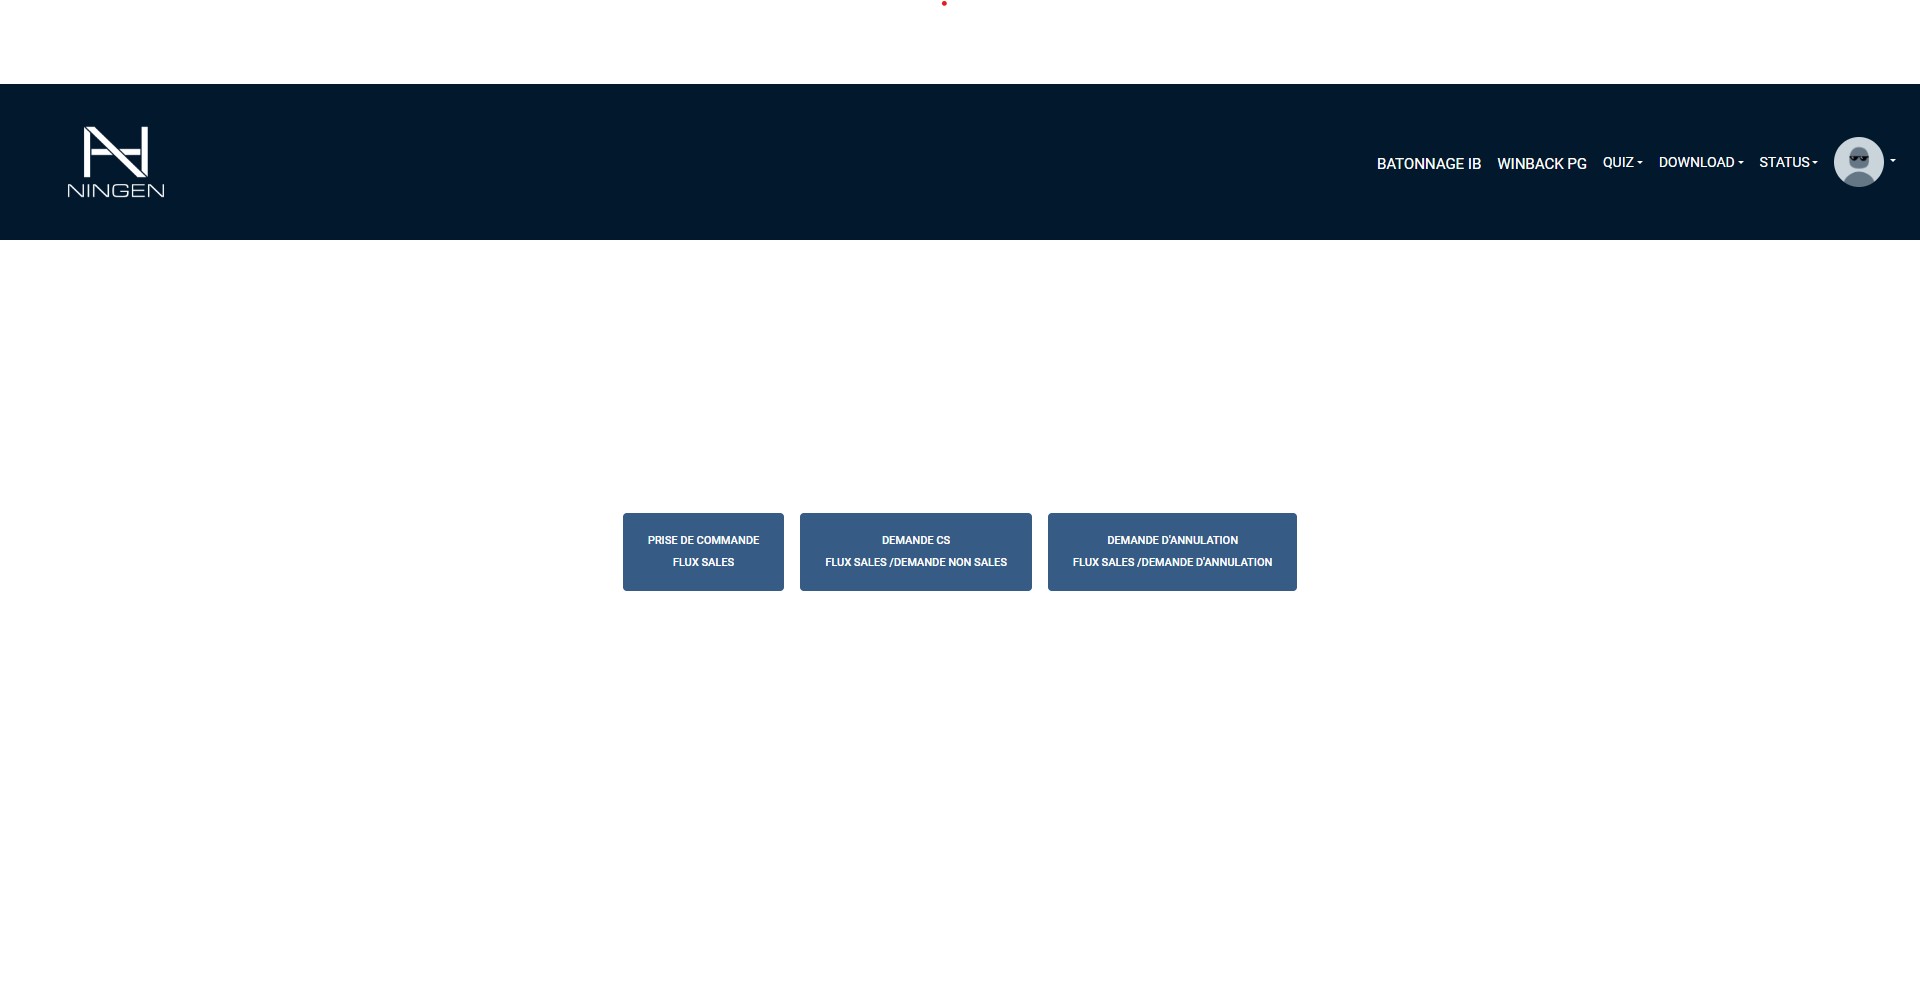
'Just before' I came onboard
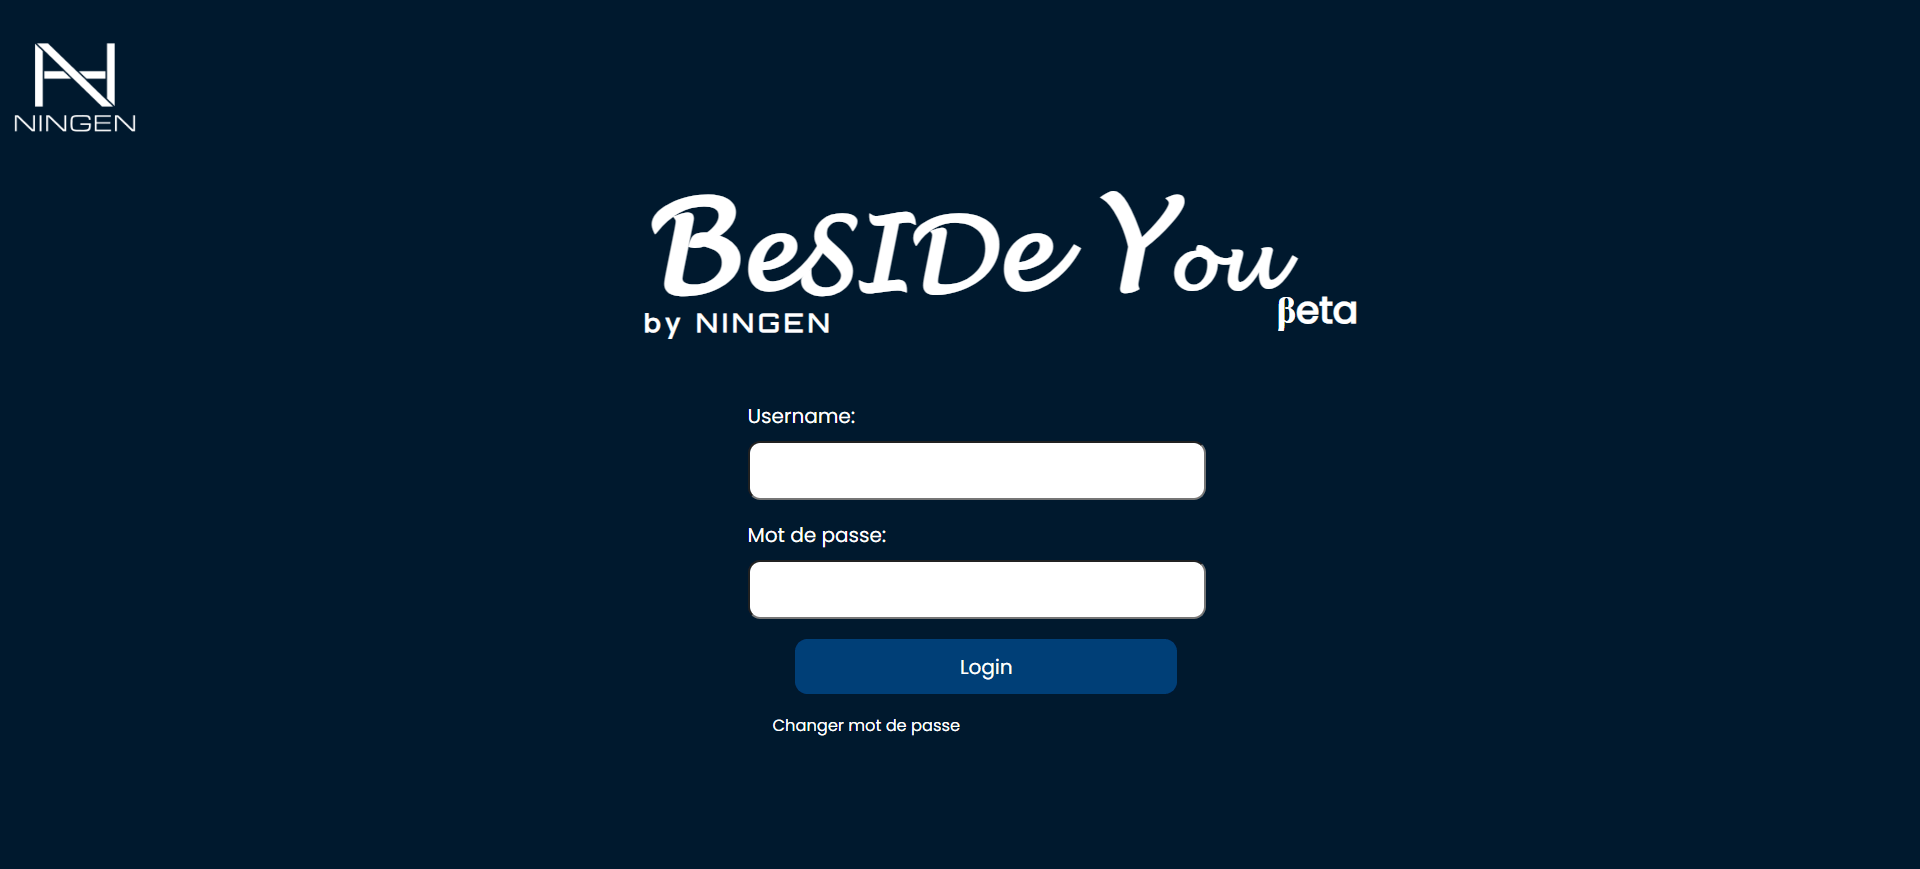
Sign In - Before
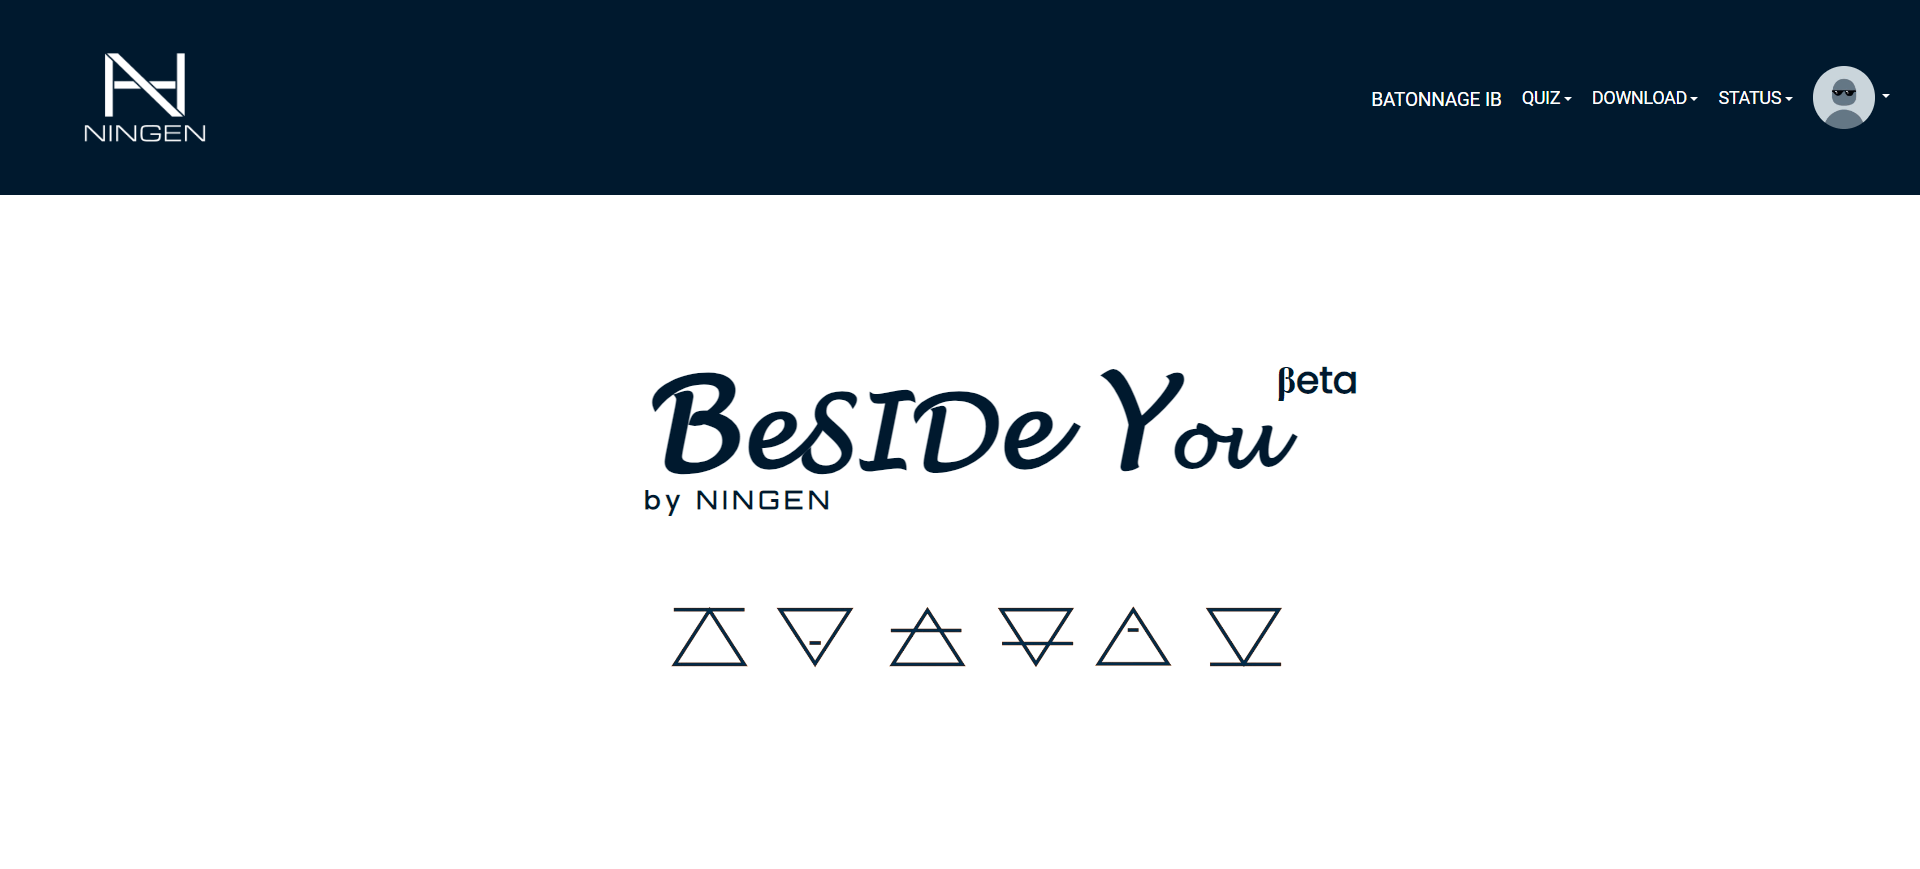
Homepage - Before
Dashboard #1 - Before
Dashboard #2 - Before
Dashboard #3 - Before
Sales Back - Before
Sales Back #2 - Before
Winback - Before
Data Viz #1
Data Viz #2
Data Viz #3
Systems Thinking & Being methodical
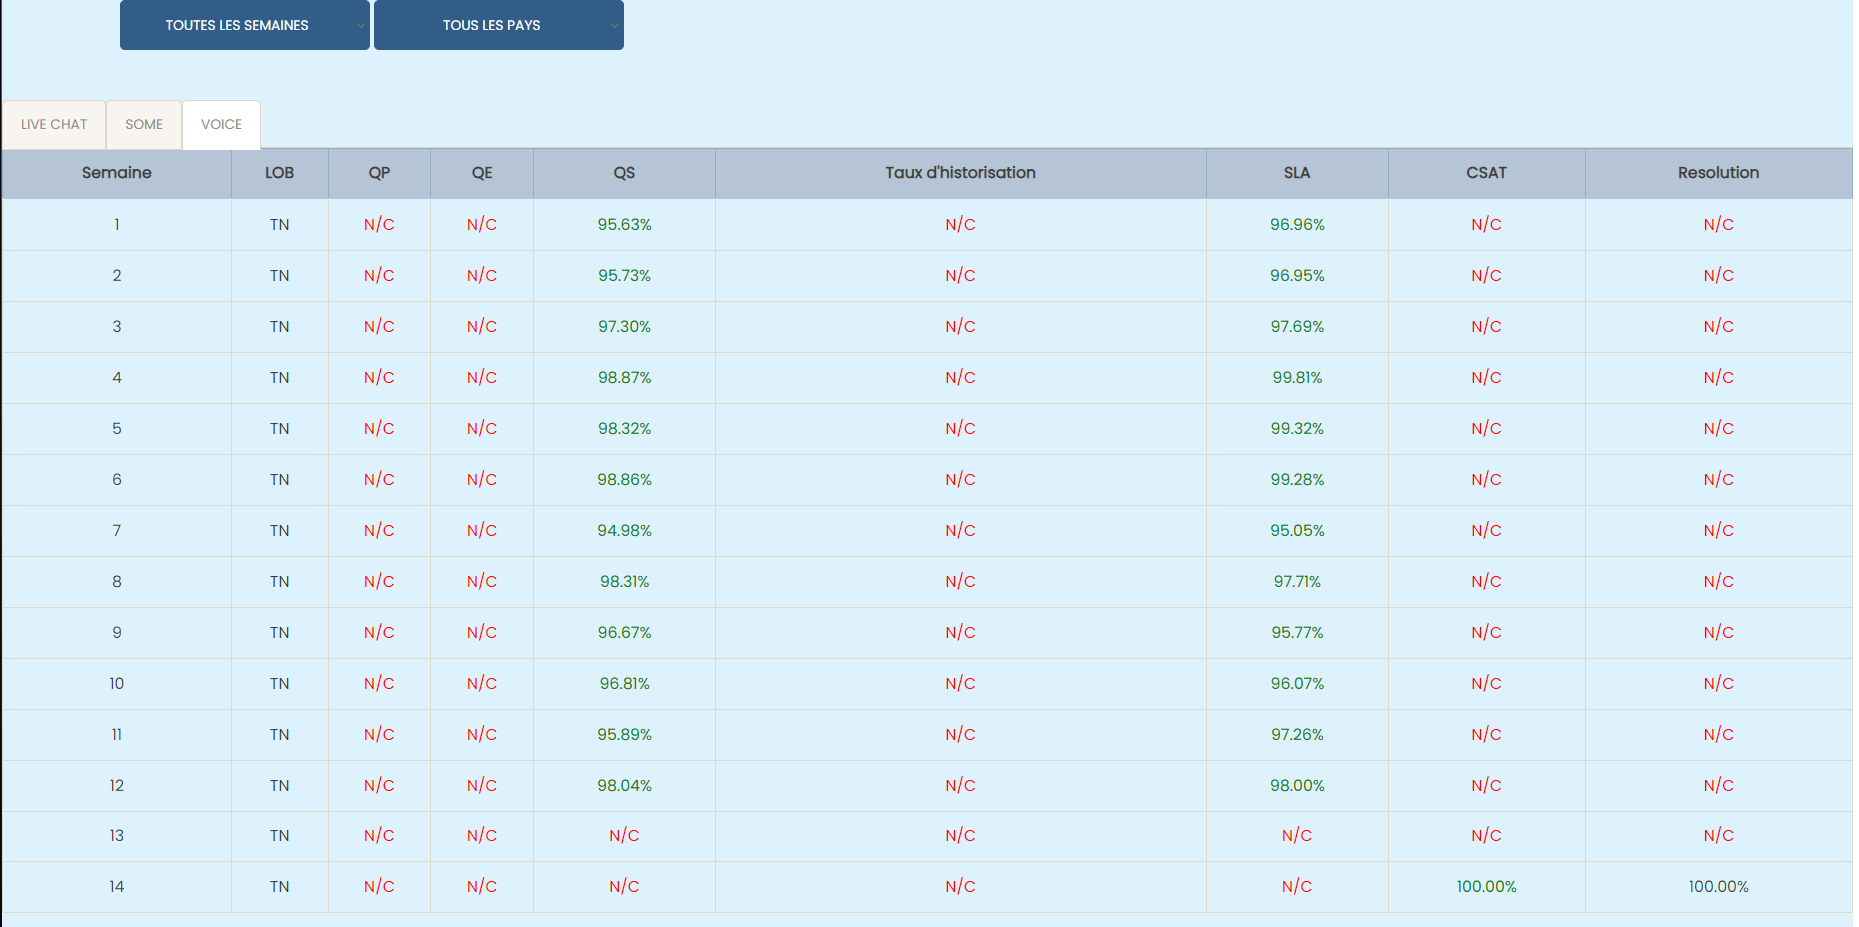
When I came onboard I found a bare-bone graph-based analytics & data-driven platform in its first step, stripped of any refined product experience.
This case study will present a meticulous implementation of my personal UX strategy and how it was practically applied.
I believe in being methodical when it comes to product design and always arriving at a systems-thinking model that will allow me to observe, pinpoint and achieve through theory and practice.
Chapter #1 | Observe
Managing shouldn’t be a Nightmare.
While high-cost and advanced tools are essential for improving customer experience, their complexity and resource demands can lead to inefficiencies, draining resources and slowing overall progress, leaving several gaps in the product experience and creating loads of business challenges.
Pinpointing the UX and business challenges
Workforce Management
Manual Real-Time Monitoring
Ineffective Resource Allocation
Cognitive Overload
Quality Compliance
Identifying underperforming Agents
Analyzing inefficient Processes
Inaccurate Data for Action Plans
Skills Development
Coaching Limitations
Training Efficiency
Skills development and recognition
Measuring the cost of problems
Huge Investments,Hidden Gaps
In the $623 billion global customer service BPO market, businesses are investing significant budgets in essential tools to stay competitive in a digital-first landscape:
15-20% ($93.45B – $124.6B) spent on CRM and telephony
10-15% ($62.3B – $93.45B) allocated to digital engagement tools
10-15% ($62.3B – $93.45B) invested in AI and automation
These investments reflect the rising demand for advanced technologies to meet the expectations of increasingly digital-savy customers and support agents with complex tasks. However, the surge in digital tools leaves managers struggling to adapt, often overwhelmed by the complexity of managing these new systems
User pain points
Managers Struggle
These investments reflect the rising demand for advanced technologies to meet the expectations of increasingly digital-savy customers and support agents with complex tasks.
However, the surge in digital tools leaves managers struggling to adapt, often overwhelmed by the complexity of managing these new systems.
They are often overlooked in the rush to adopt new technologies, creating a critical support gap. Empowering these managers with the right tools is key to successfully navigating digital transformation
Extracting the business and stakeholders vision
Augmented Manager
The vision basically consisted of arriving at a MVP that will be a forthecoming SaaS in the management and CX industry.
Fundamentally, the goal is to be disruptive, innovative and achieve the differentiating factors throughout the product life cycle.
Ultimately, a SaaS platform designed to transform management by helping managers make better decisions, boost performance, and allocate resources efficiently.
Customer Experience Eco System
The vision was to build a solution to empower the “Augmented Manager”, equipping leaders with advanced tools and analytics to optimize real-time-onsite–remote-team performances and deliver outstanding results in an increasingly complex, tech-driven customer experience ecosystem.
Solution Overview
Effortless Management, Maximum Impact
Beside.you is a Software As A Service solution developed to simplify decision-making and boost efficiency for managers.
By solving the biggest business challenges along with intuitive functionalities, simplifying business steering, performance management, and resource allocation. It is shaping a future where all business tools work seamlessly together, unlocking unmatched operational excellence for organizations everywhere
Chapter #2 | Think
The Pre Build
After all the user interviews, narrative observation, psychology analysis, and ideation, I always like to gather every lead and arrive at a systems thinking model.
All the processes were iteratively analyzed and observed.
Two main systems were interpreted:
Micro Macro Dynamic
Prescriptive Descriptive Predictive
Micro Macro Dynamic
The Micro level deals with data that is on the surface and it is designated for customers/users who are looking to make a quick action plan or come up with a decision that affects the business trajectory in the short run.
Macro level deals with data that is on the opposite side of the spectrum, giving users a more in-depth look into what can be optimised without compromising on spending too much time monitoring or observing.
Prescriptive Descriptive Predictive
This system addresses the behavior of visualizing data within the product and its life cycle:
Prescribing anomalies and inconsistencies to identify what needs to be iterated or changed, like identifying underperforming employees or analyzing inefficient processes.
Describing the exact issue for users to make a quick action plan or to dive deeper and trace the origin of inaccurate data that caused the anomaly.
Predictive, which will predict issues based on a pre-determined forecast of data, to address the pain point of manually monitoring data in real time, which will lead to effective resource allocation.
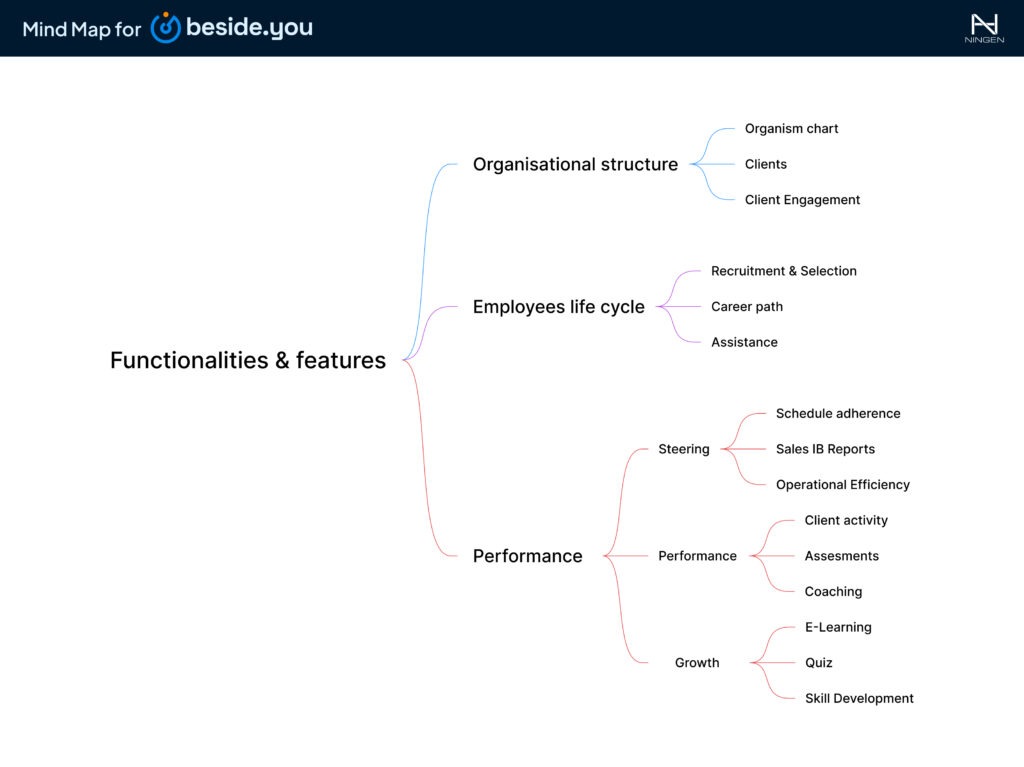
Mind Map
Creating a mind map was an essential element to the whole picture since it allowed me to extract the stakeholders vision and paint the roadmap of the product features
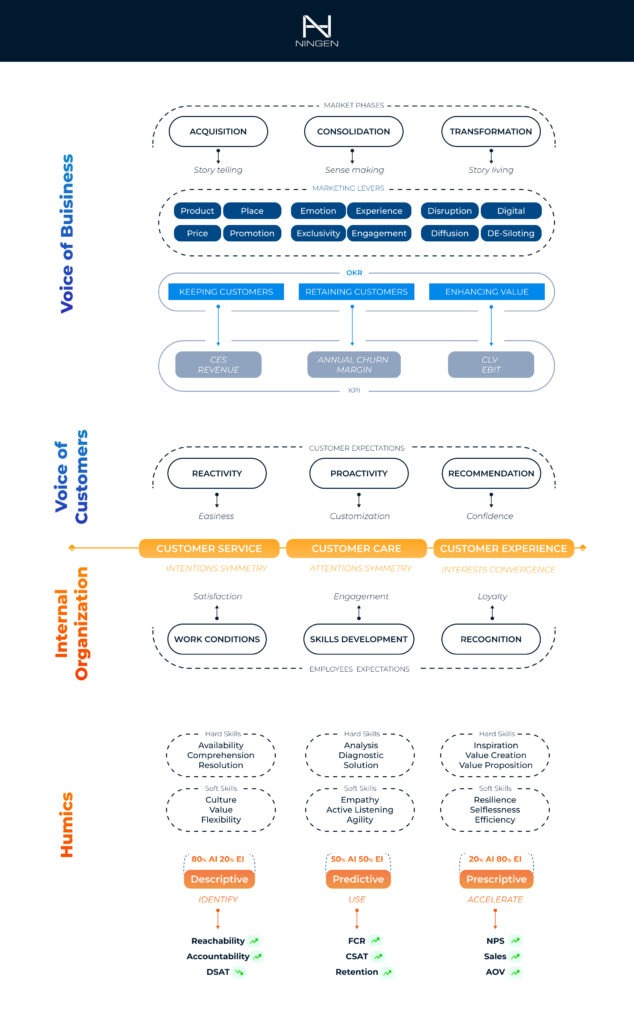
Business Map
Creating a business map allowed me to visualize the business plan holistically from top to bottom and structure everything on a new level
The last ingredient ; the UX methodology
I fundamentally wanted to work with a UX methodology that would work well within a startup environment, also with the systems mentioned above as well as in terms of collaboration with the dev and data teams without losing the momentum at any given stage
Eventually, I chose the one and only:
Lean UX
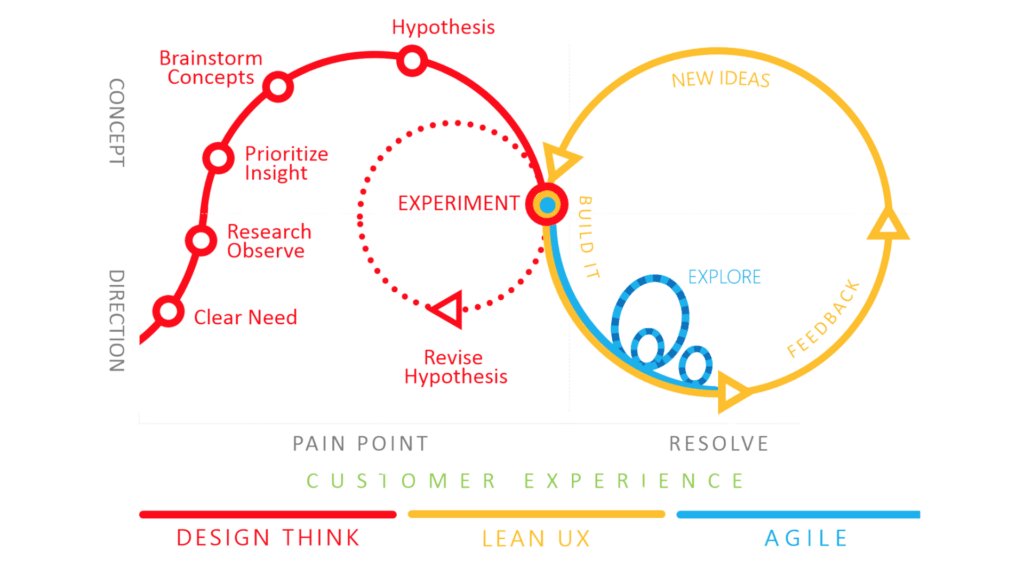
This comprehensive graphic shows how we did it and the intricacies of the cyclical process of Lean UX that we followed
Why Lean UX?
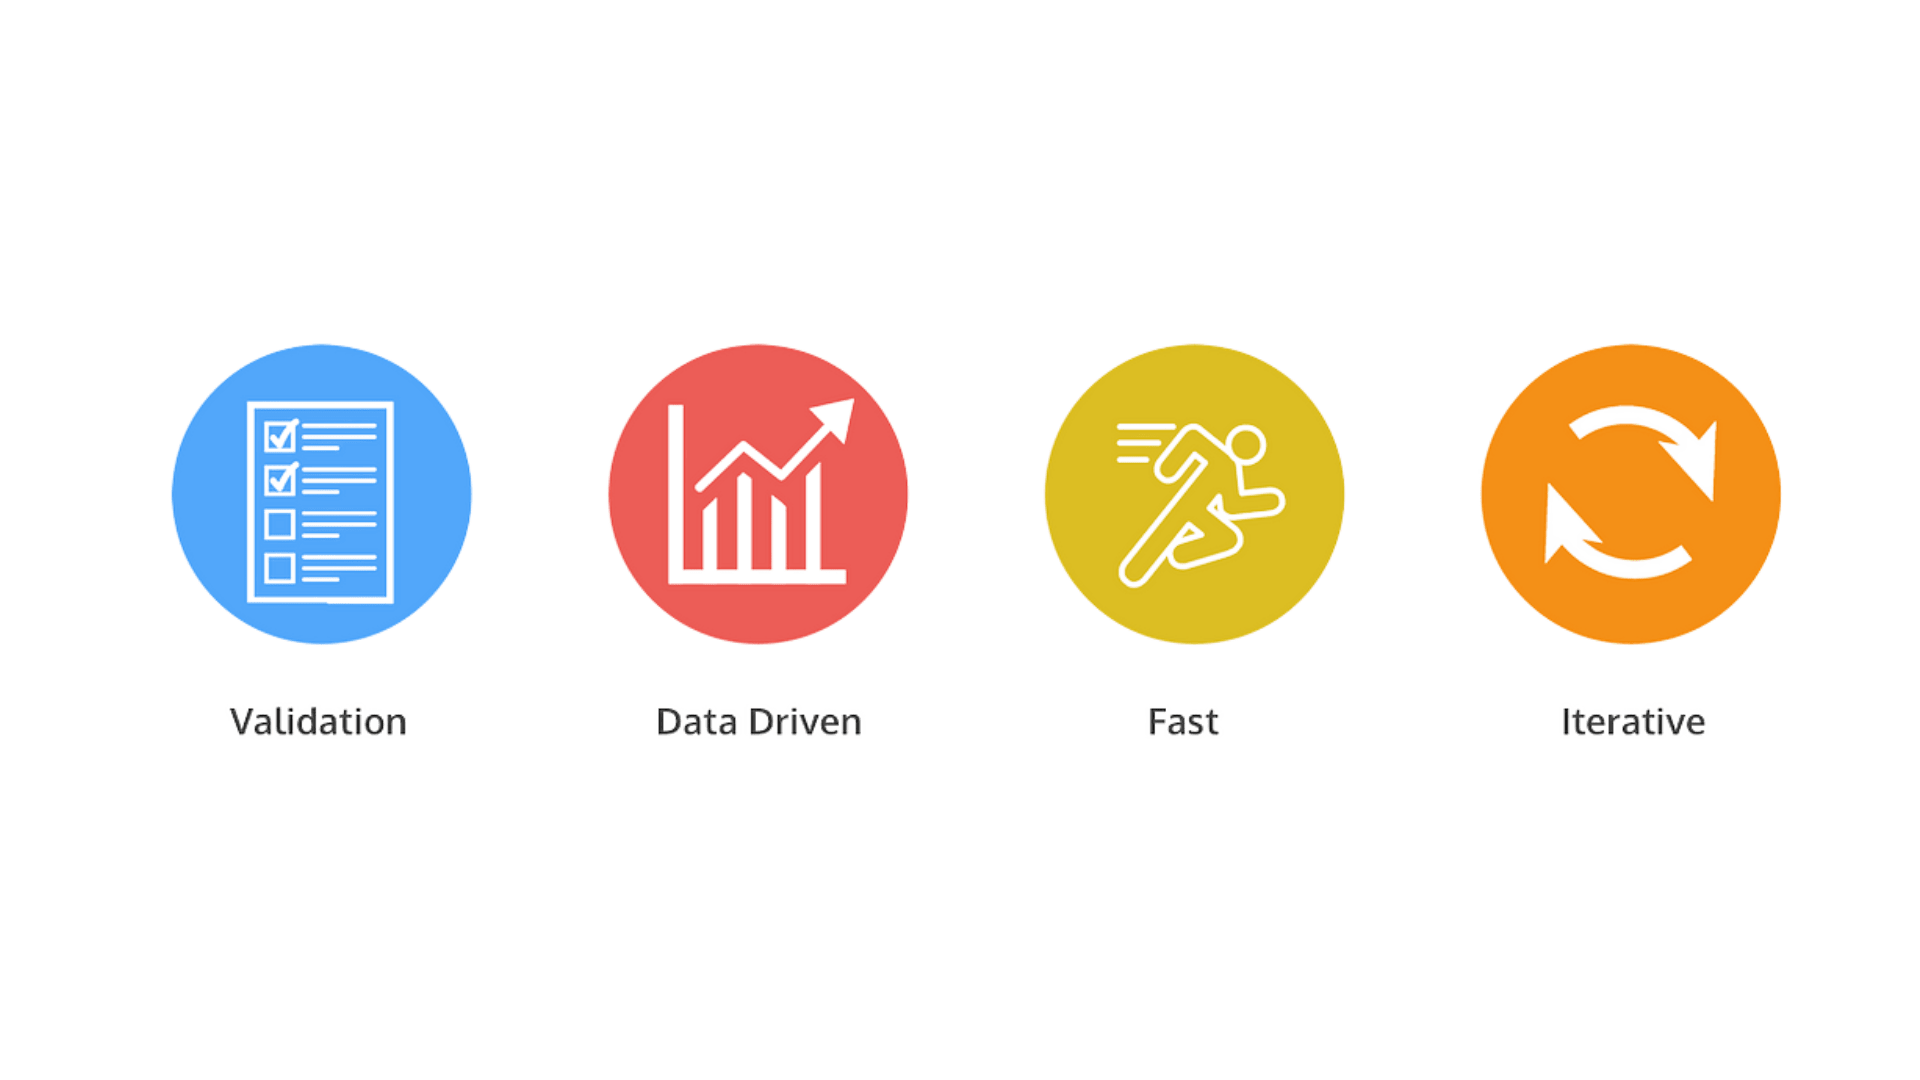
A to B graphic that shows the core properties of the Lean UX process that we followed
Lean UX correlates well with the micro-macro dynamic since it also focuses on the iterative process and the cycle loops of starting broad and narrowing down to the optimal solution.
Also addressing the business problems and outcomes while observing, learning and coming up with optimal solutions and ideas.
As well as Lean UX is synonymous with modern product design and development. By combining human-centric design, agile ways of working, and a strong business sense.
Chapter #3 | Build
Design system | UI Guidelines
I started by crafting the design system component by component. I wanted to create a flexible system that would last the test of time and could be tweaked, scaled and optimized at any given moment. Ultimately, the goal was to increase the velocity of the design and development.
Product Branding
The main vision from the get go was to create a branding language that reflect the ethos of the product in terms of its user interface and user experience, highlighting the user friendliness and intuitiveness while remaining sharp and professional in its core, both on the prescriptive and the descriptive level.
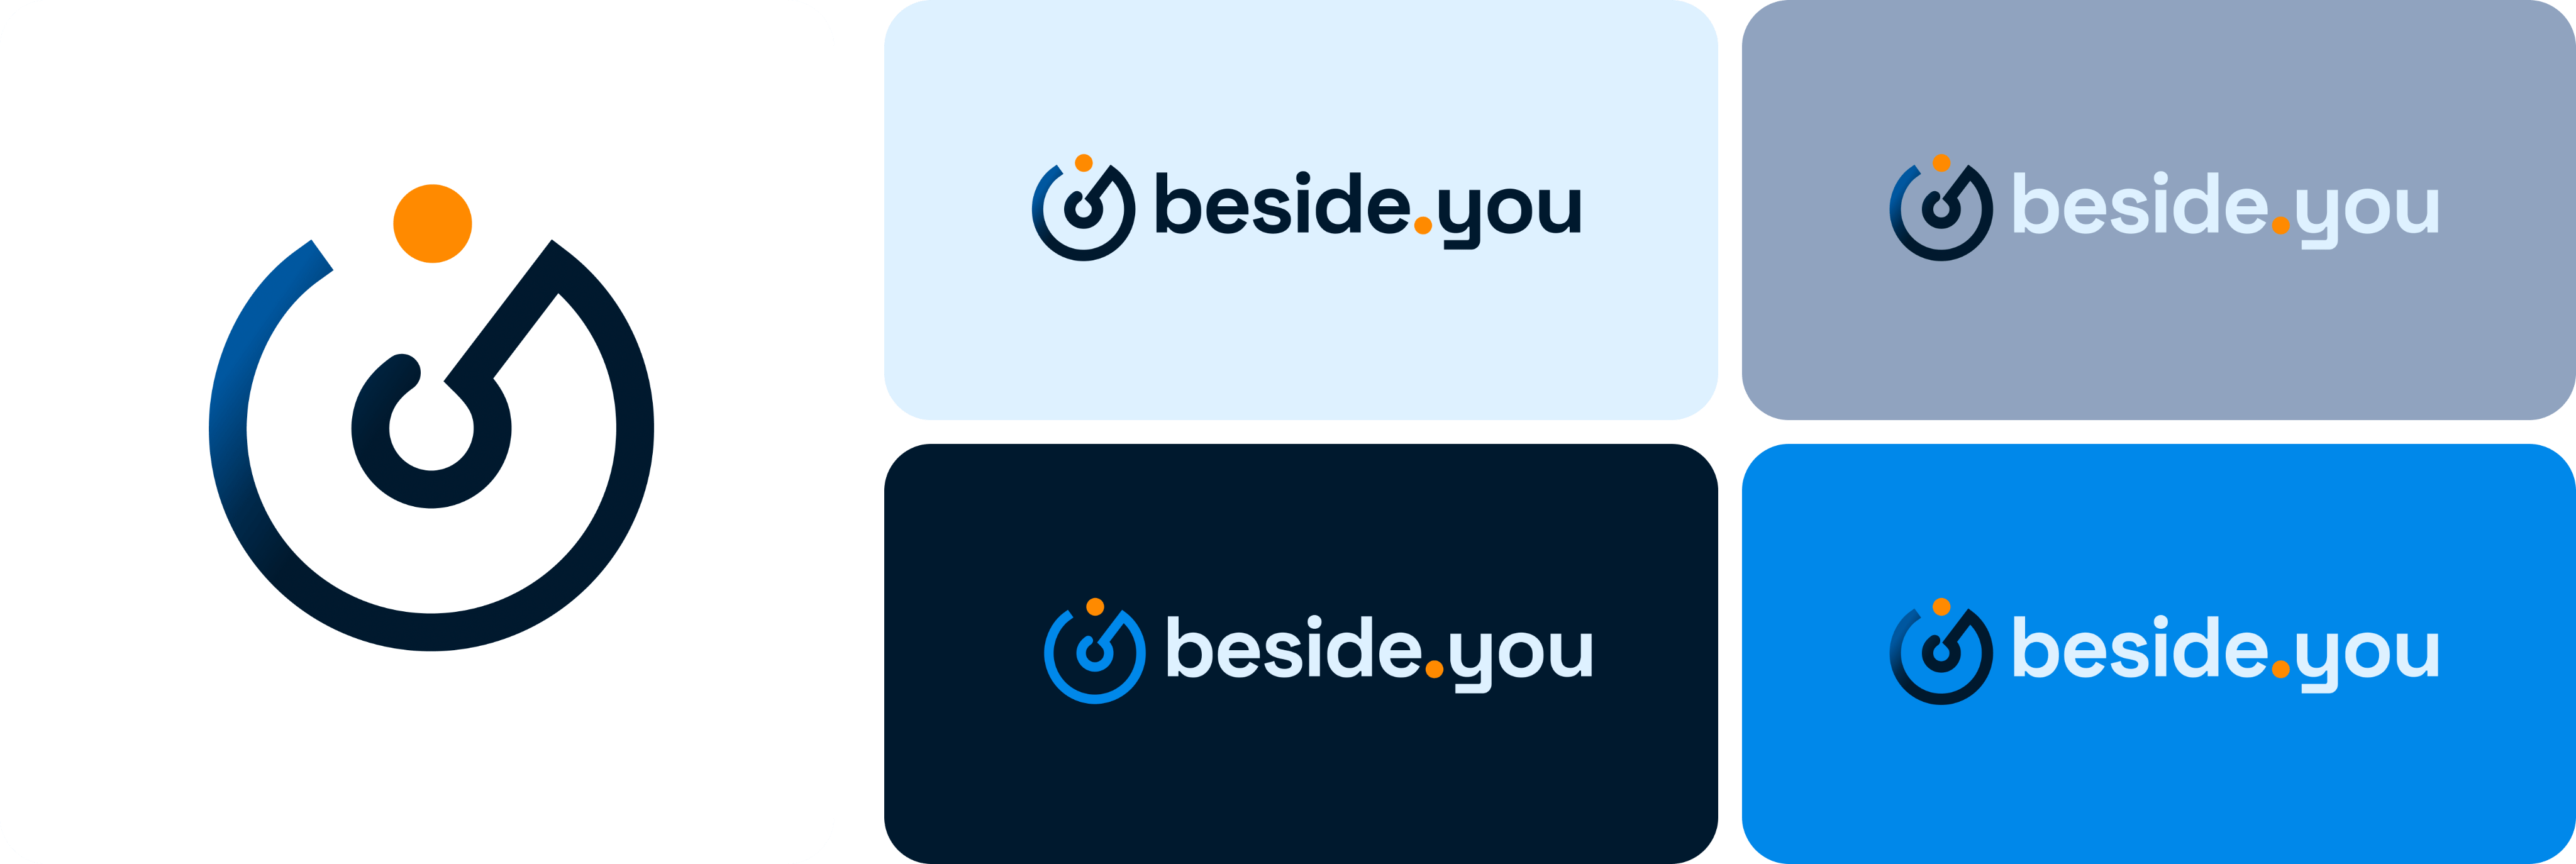
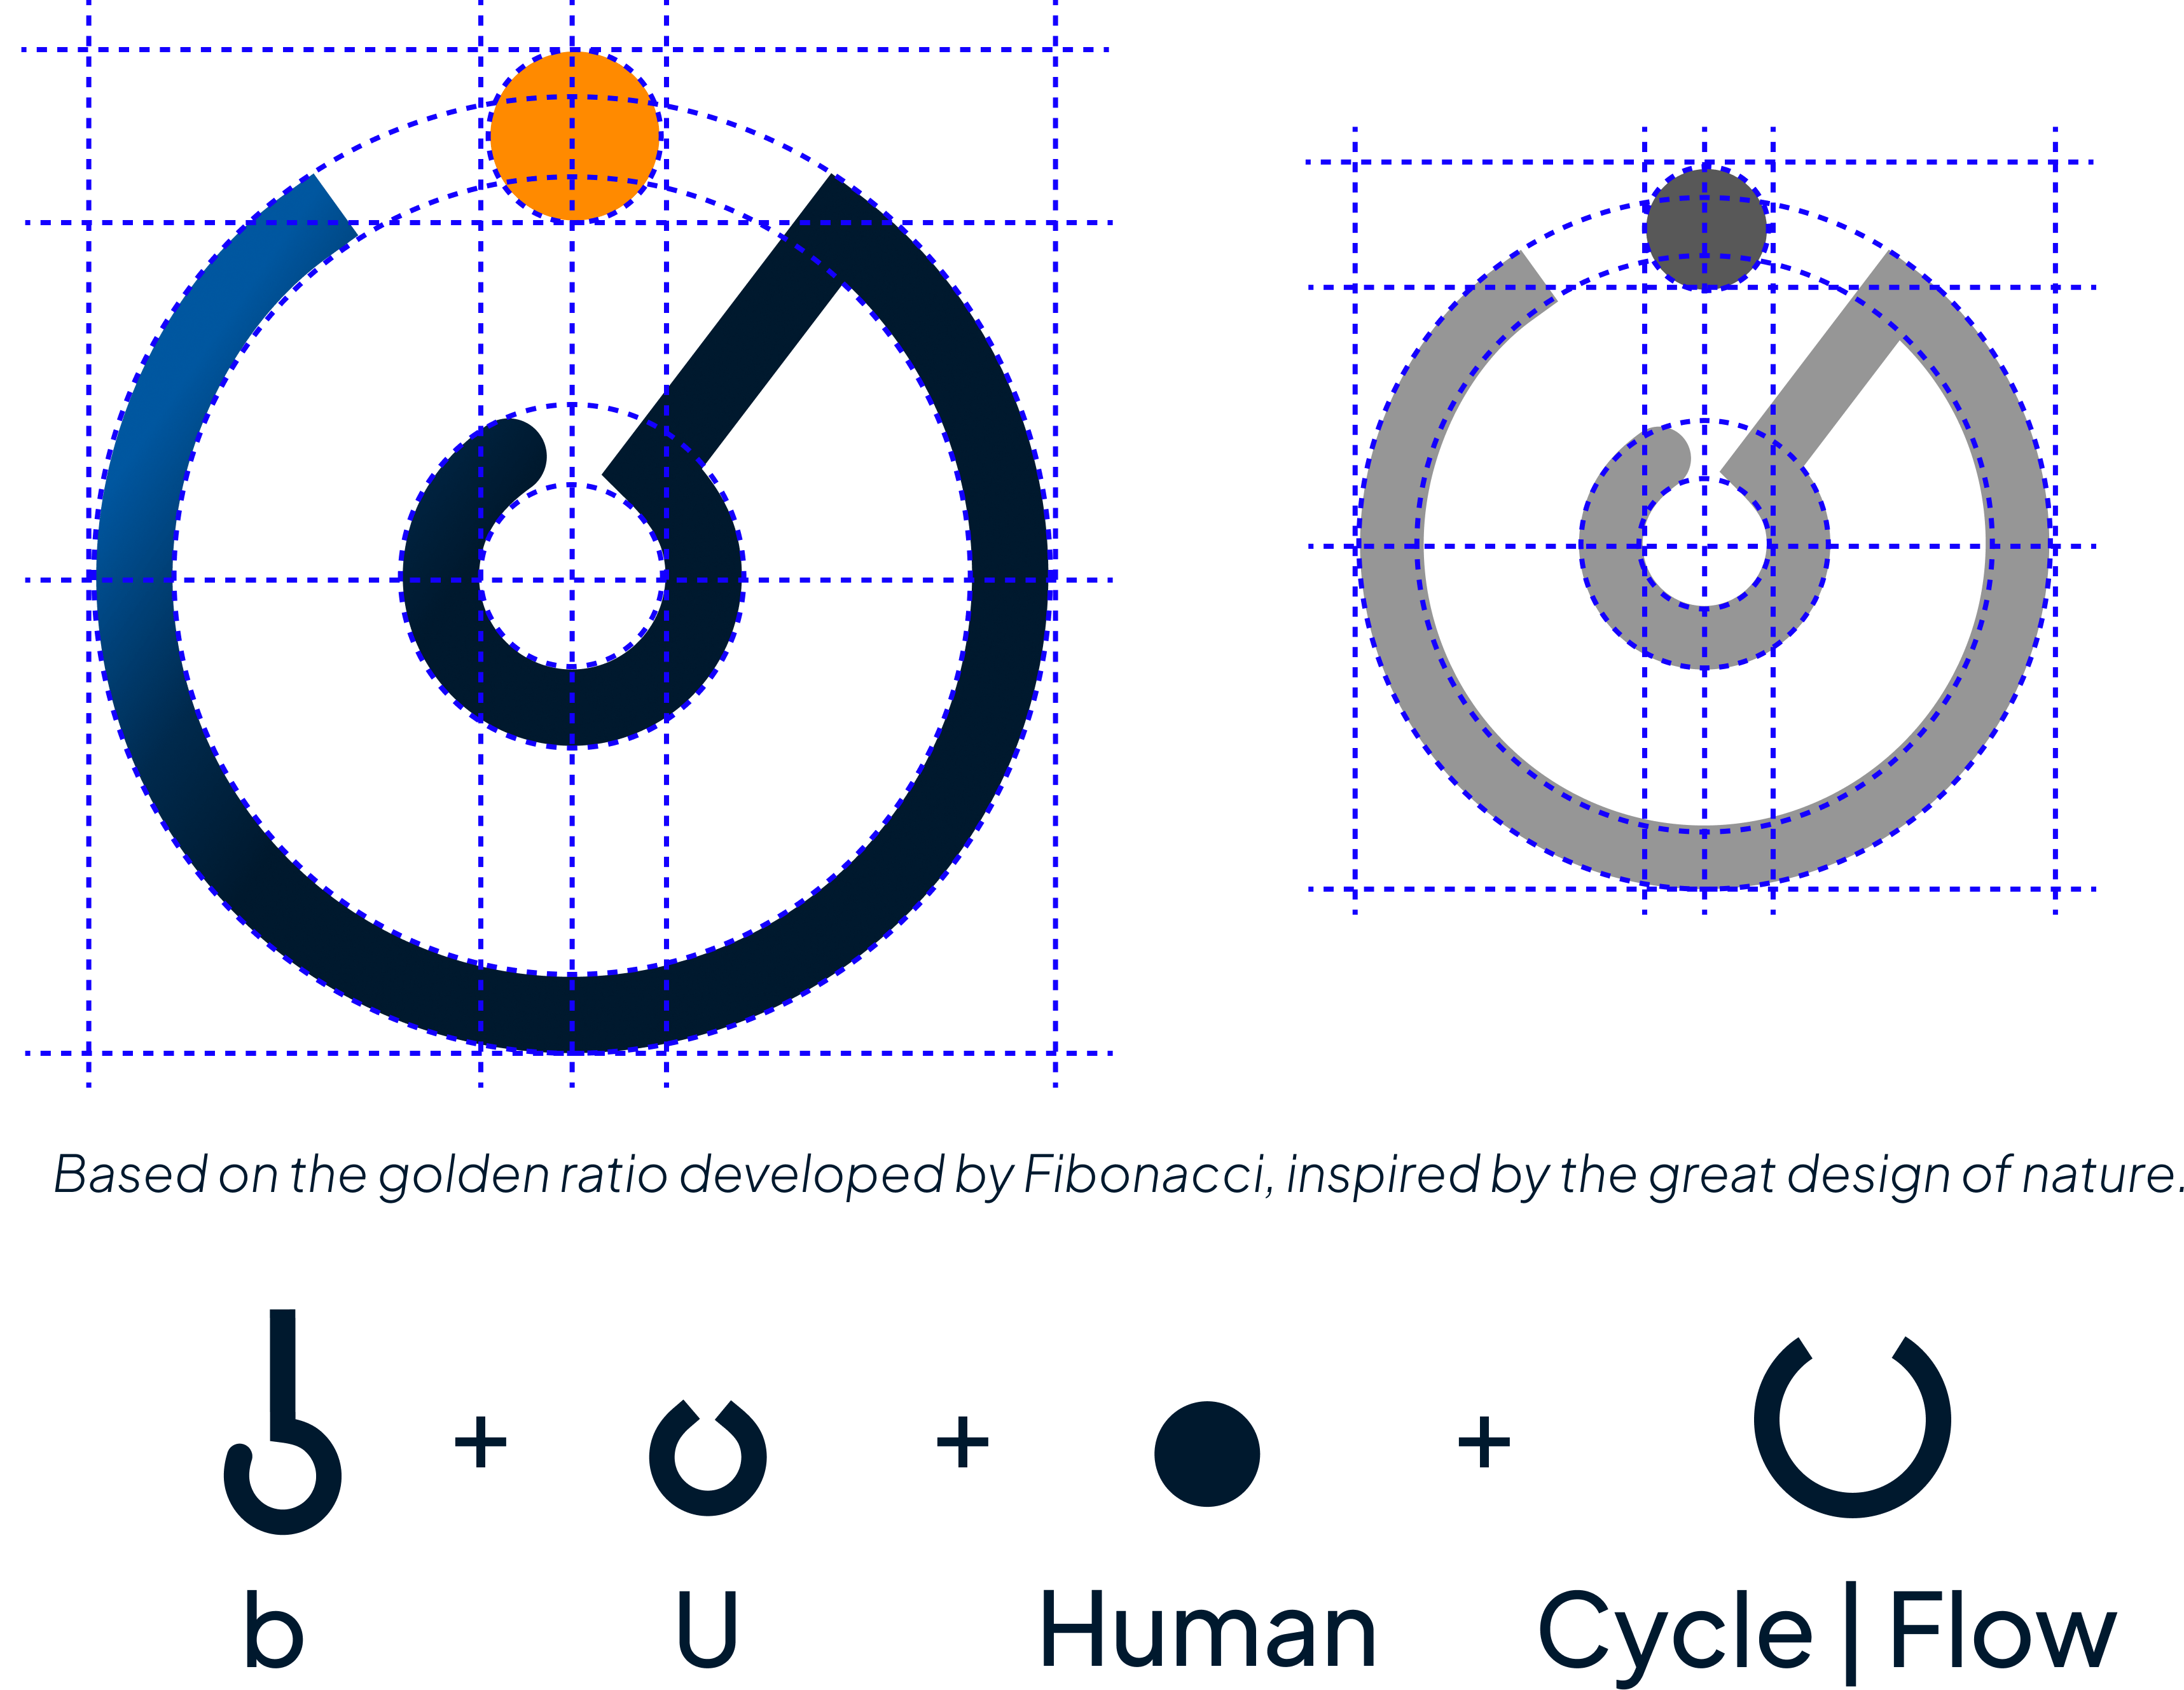
Logotype: Ethos & principles
The icon design combines the letter b, the letter u (as ‘you’) cycling and flowing around the human element that is ‘standing tall’ and since he is the essence of it all.
The combination of the gradual shades of blue with the orange inspires professionalism, allure and trust.
All these elements together created a character that is in line with the vision of the client and the mission of the business as a whole.
Loading and Onboarding Logo Animation
I designed a logo animation for Beside You new visual identity. My intention was to create something that would be aesthetically appealing and would serve the loading speed when first entering the web app. I exported the animation to a JSON file so it can be easily embedded later.
Data Visualization for Human Decisions
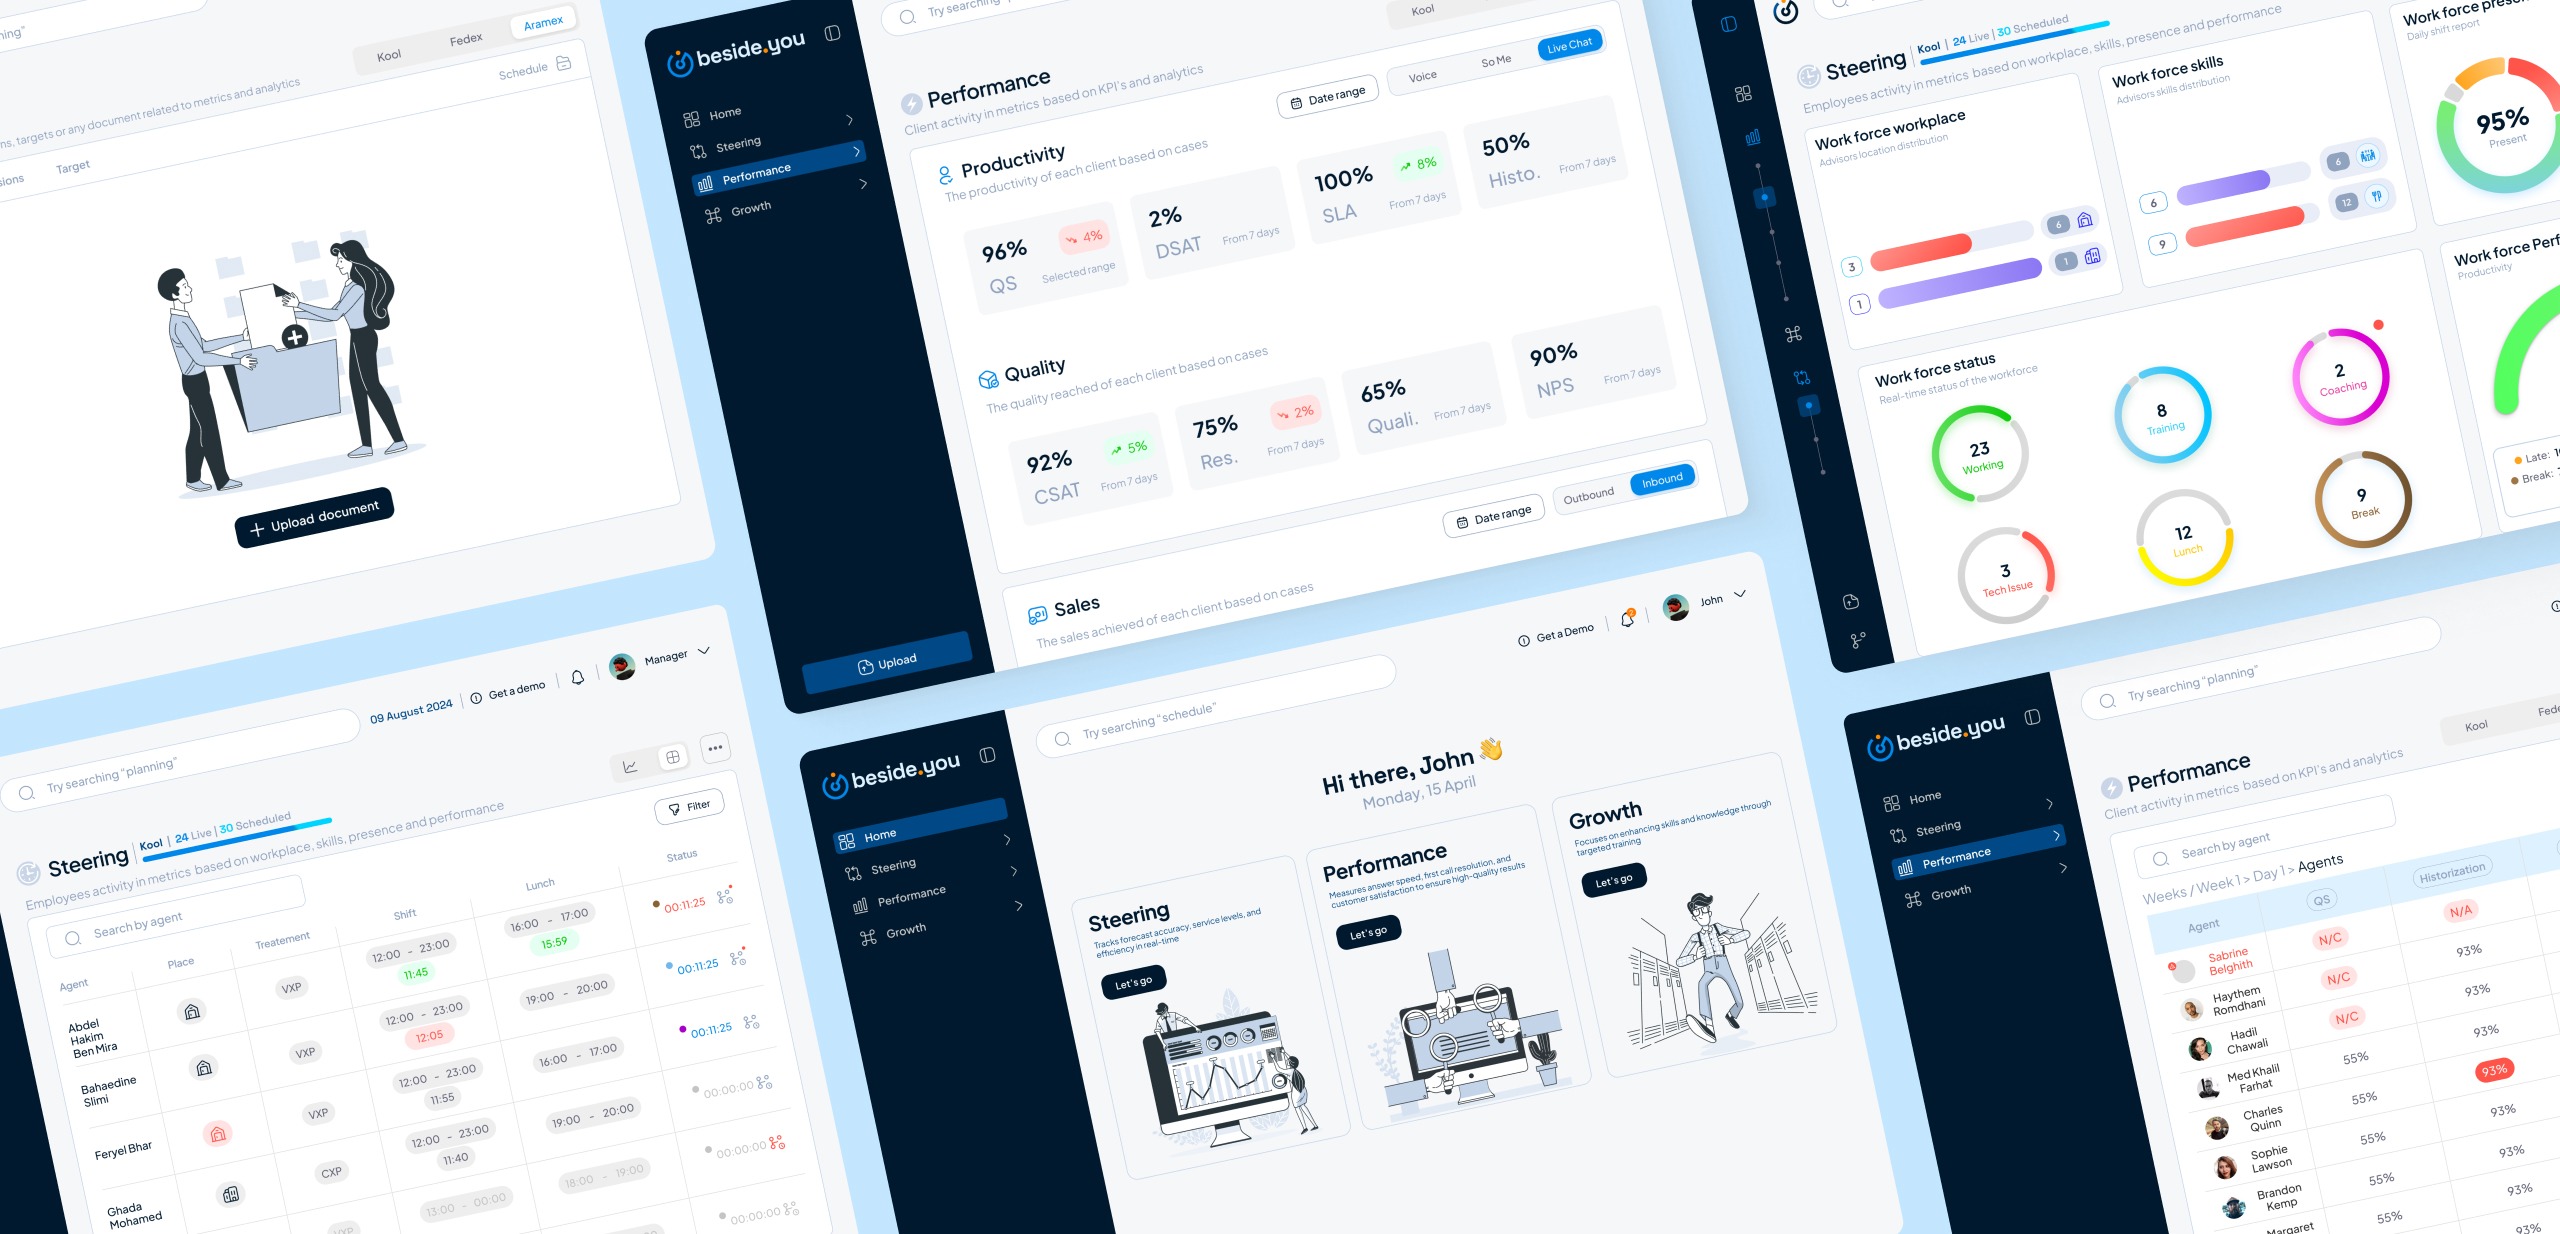
I wanted to build a living product experience with the most user-friendly UI, designing bold components with vivid colors and interactive features, such as charts and tables, for meaningful data visualization and analysis, without compromising the visual consistency.
Developers vs Designers?
One of many challenges we faced in the R&D process was developing bespoke/custom-made charts designed in Figma without using a pre-existing library like Charts.js or Apex charts.
Through collab and research, we found a js library called D3.js, a library made for dynamic data visualization used for instance in weather forecasts and complex trading graphs.
Once again, starting broad, testing, learning, iterating, and narrowing in on the optimal solution with each stage can go a long way.
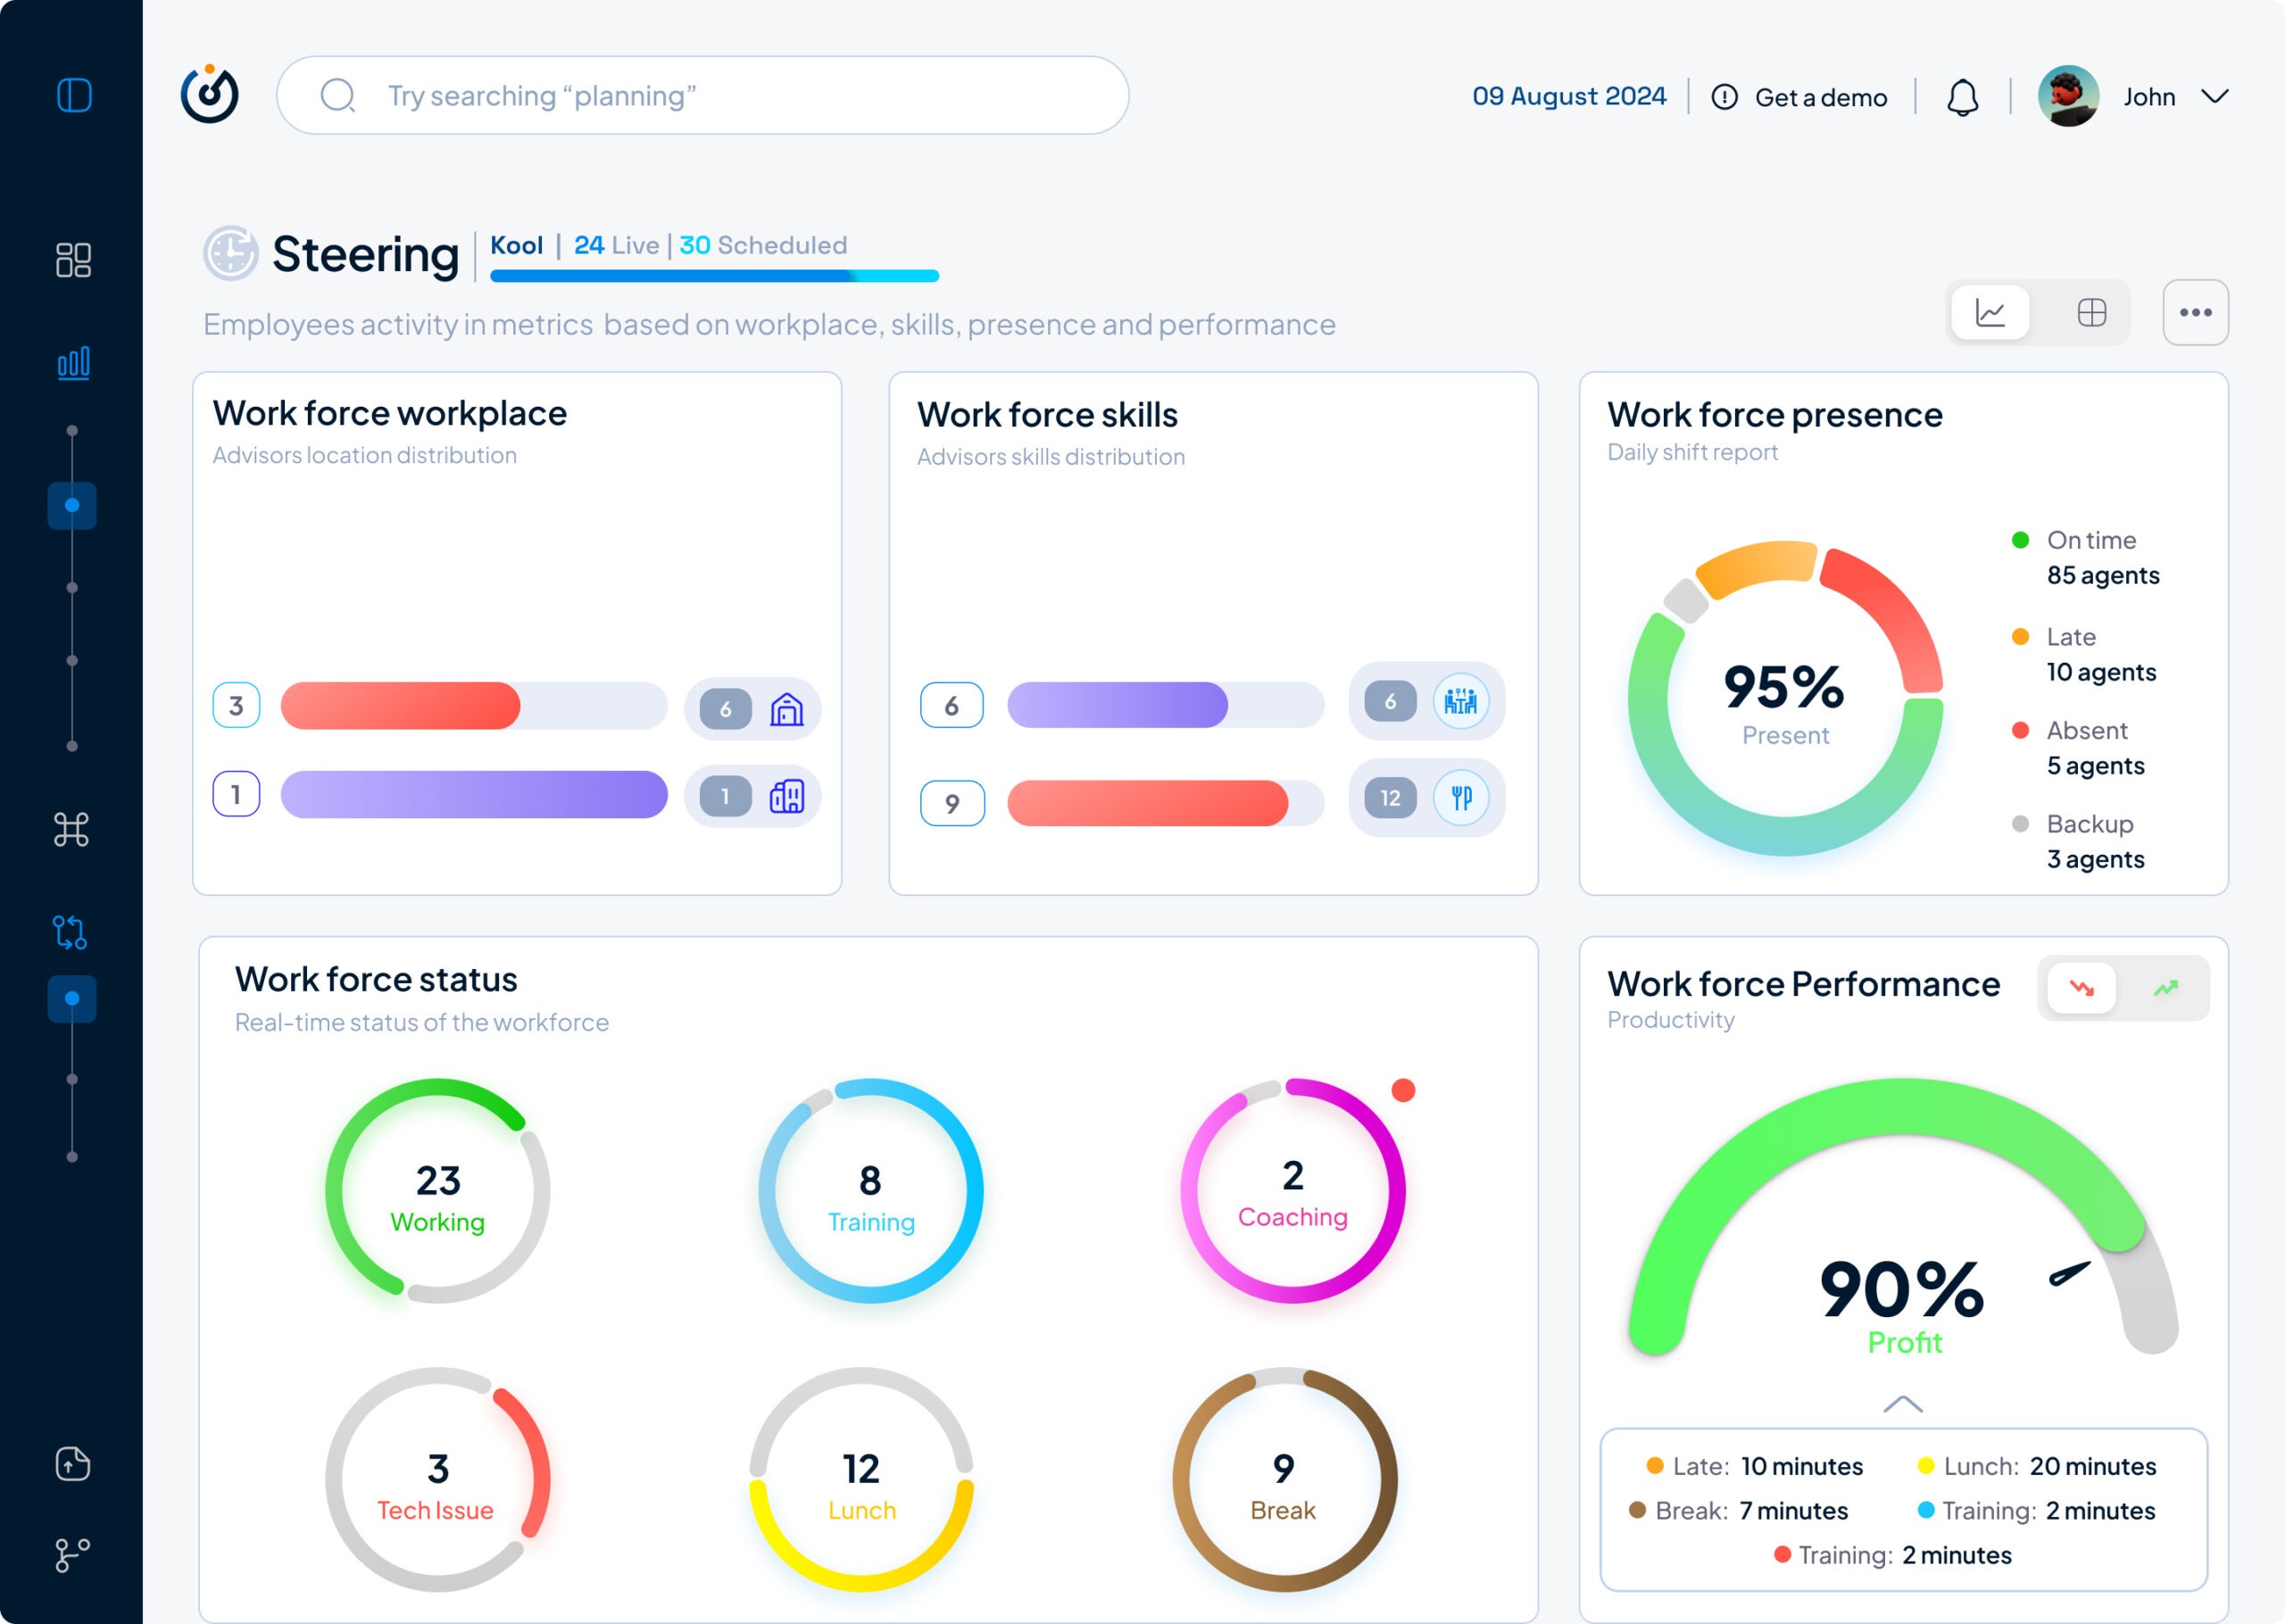
Intuitive transitions between data sets
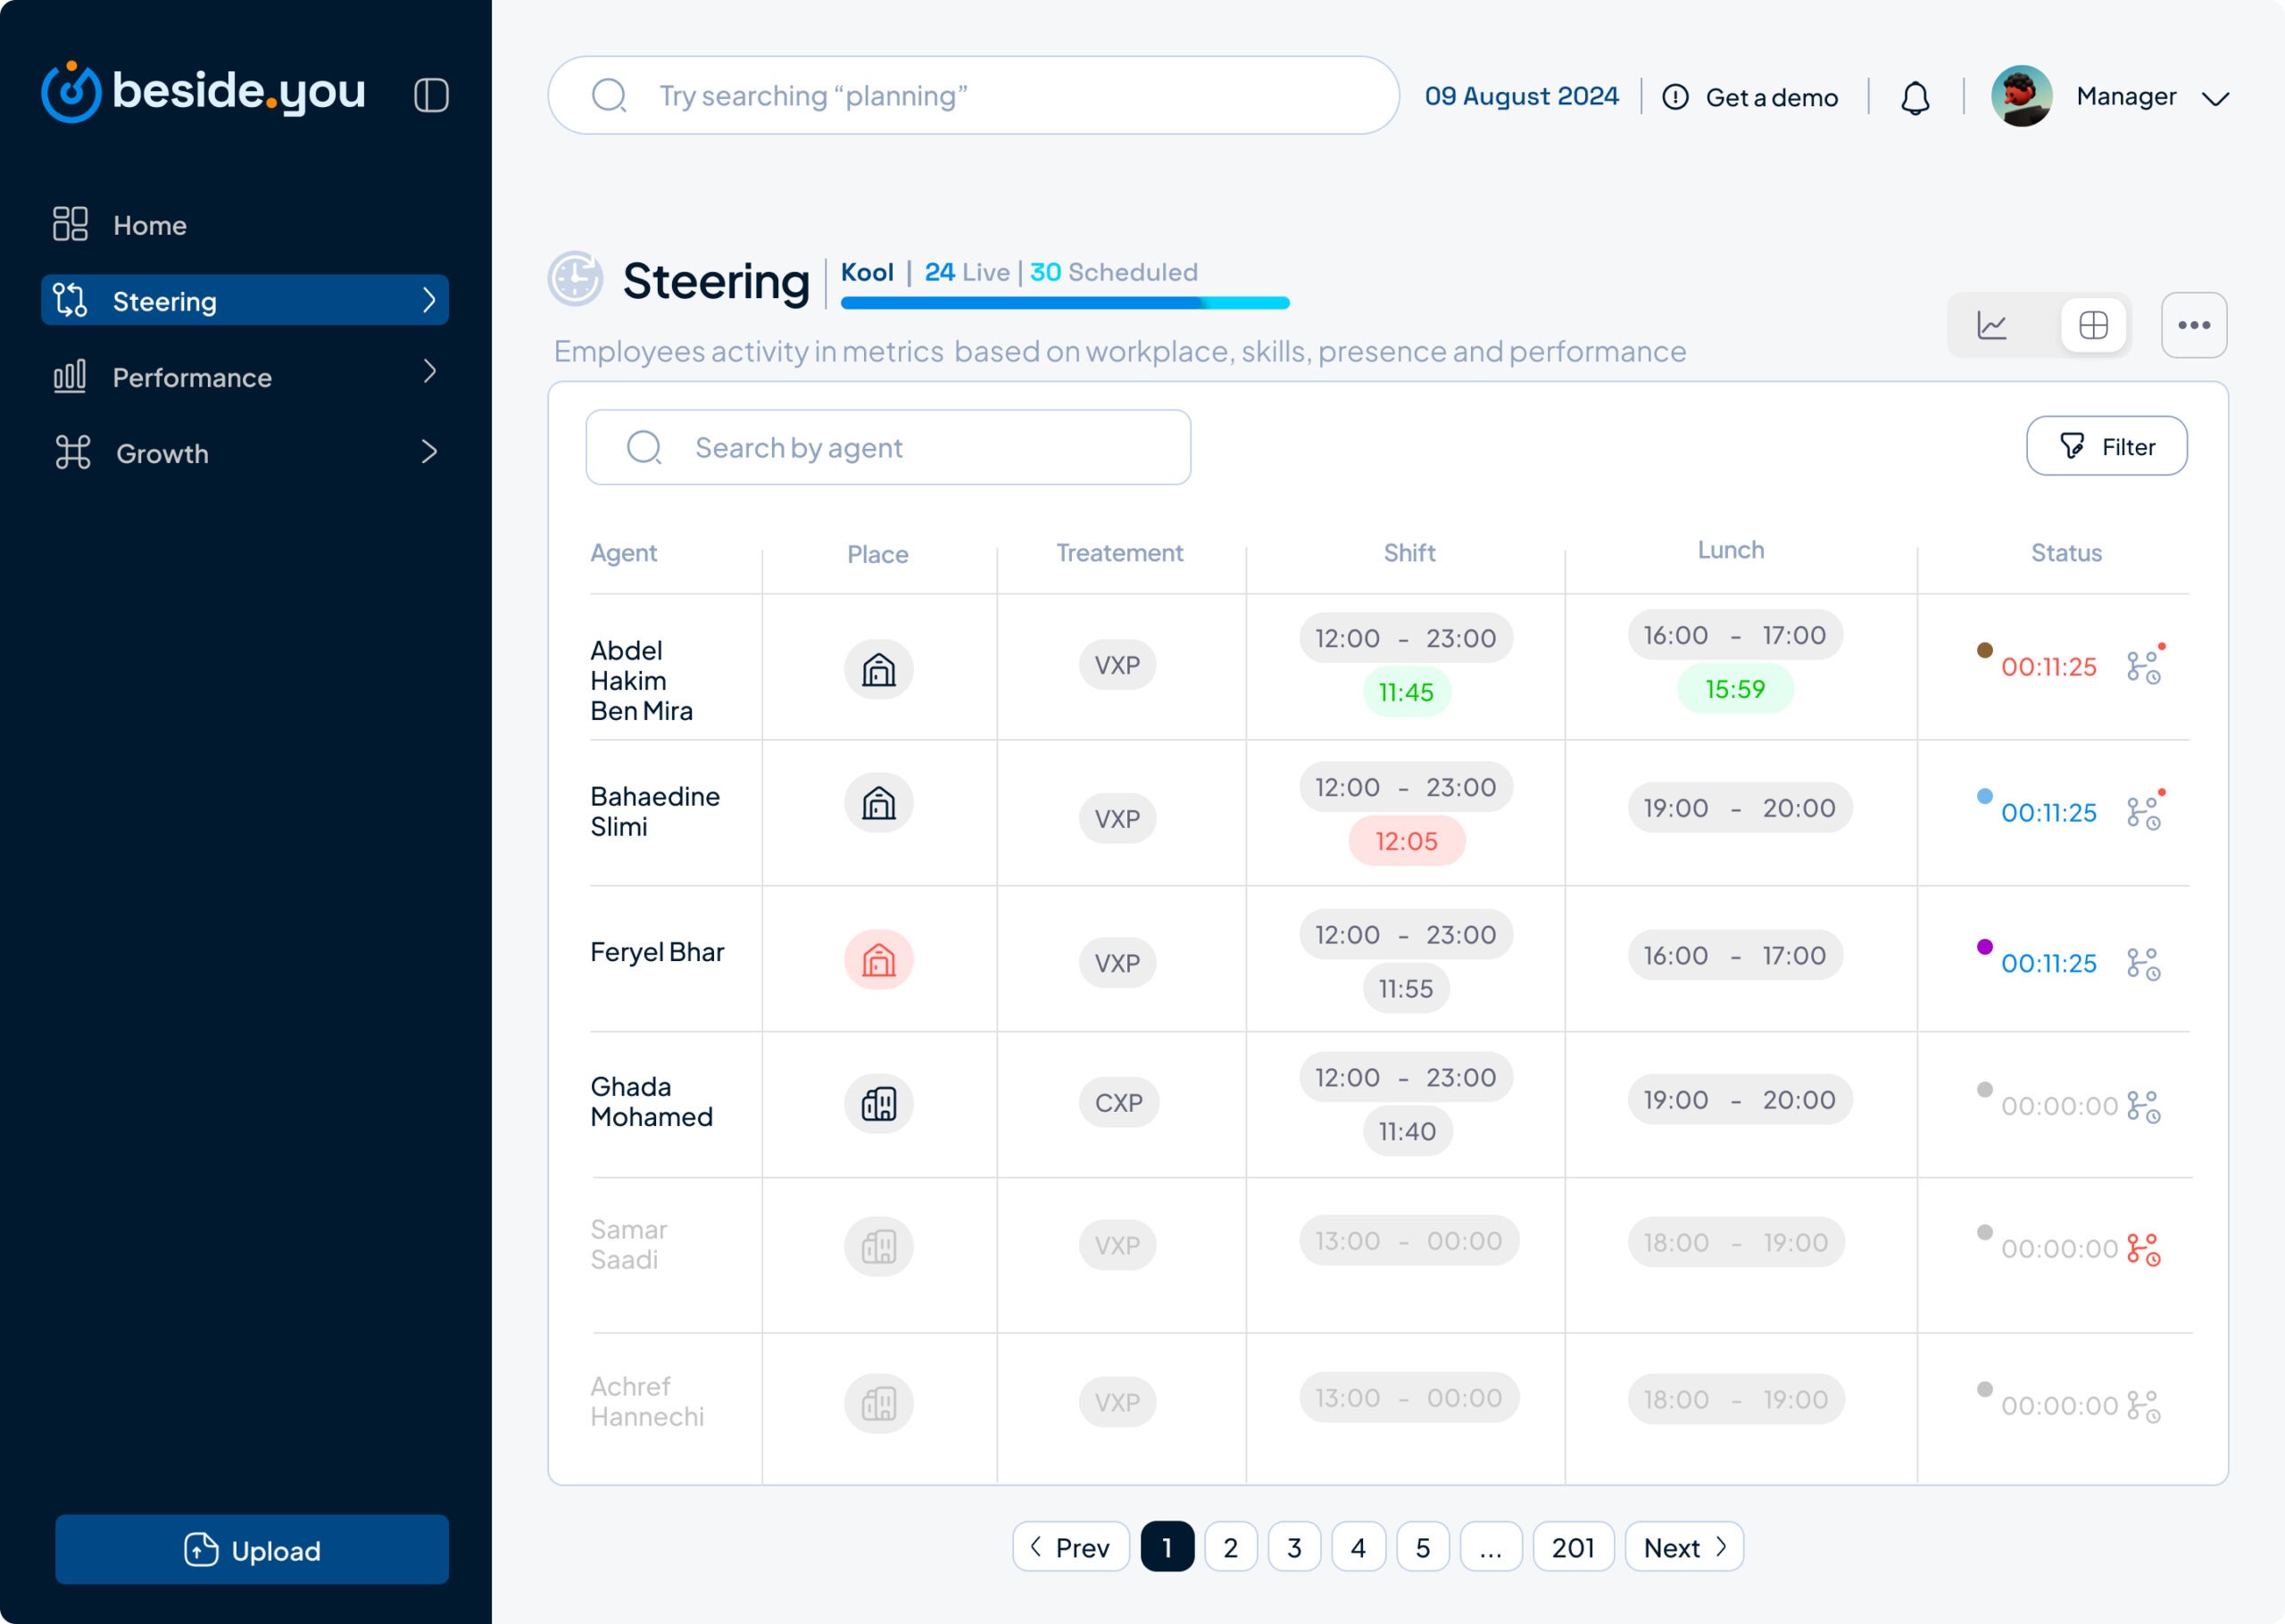
In order for me to keep the UI uncluttered, easy to use and keep the UX with as little cognitive load as possible, I opted for a tab switch that shifts the Steering page from the data table to the dashboard without many clicks, leaving room for the user to focus on the task ahead.
Modular layout system with seamless transitions
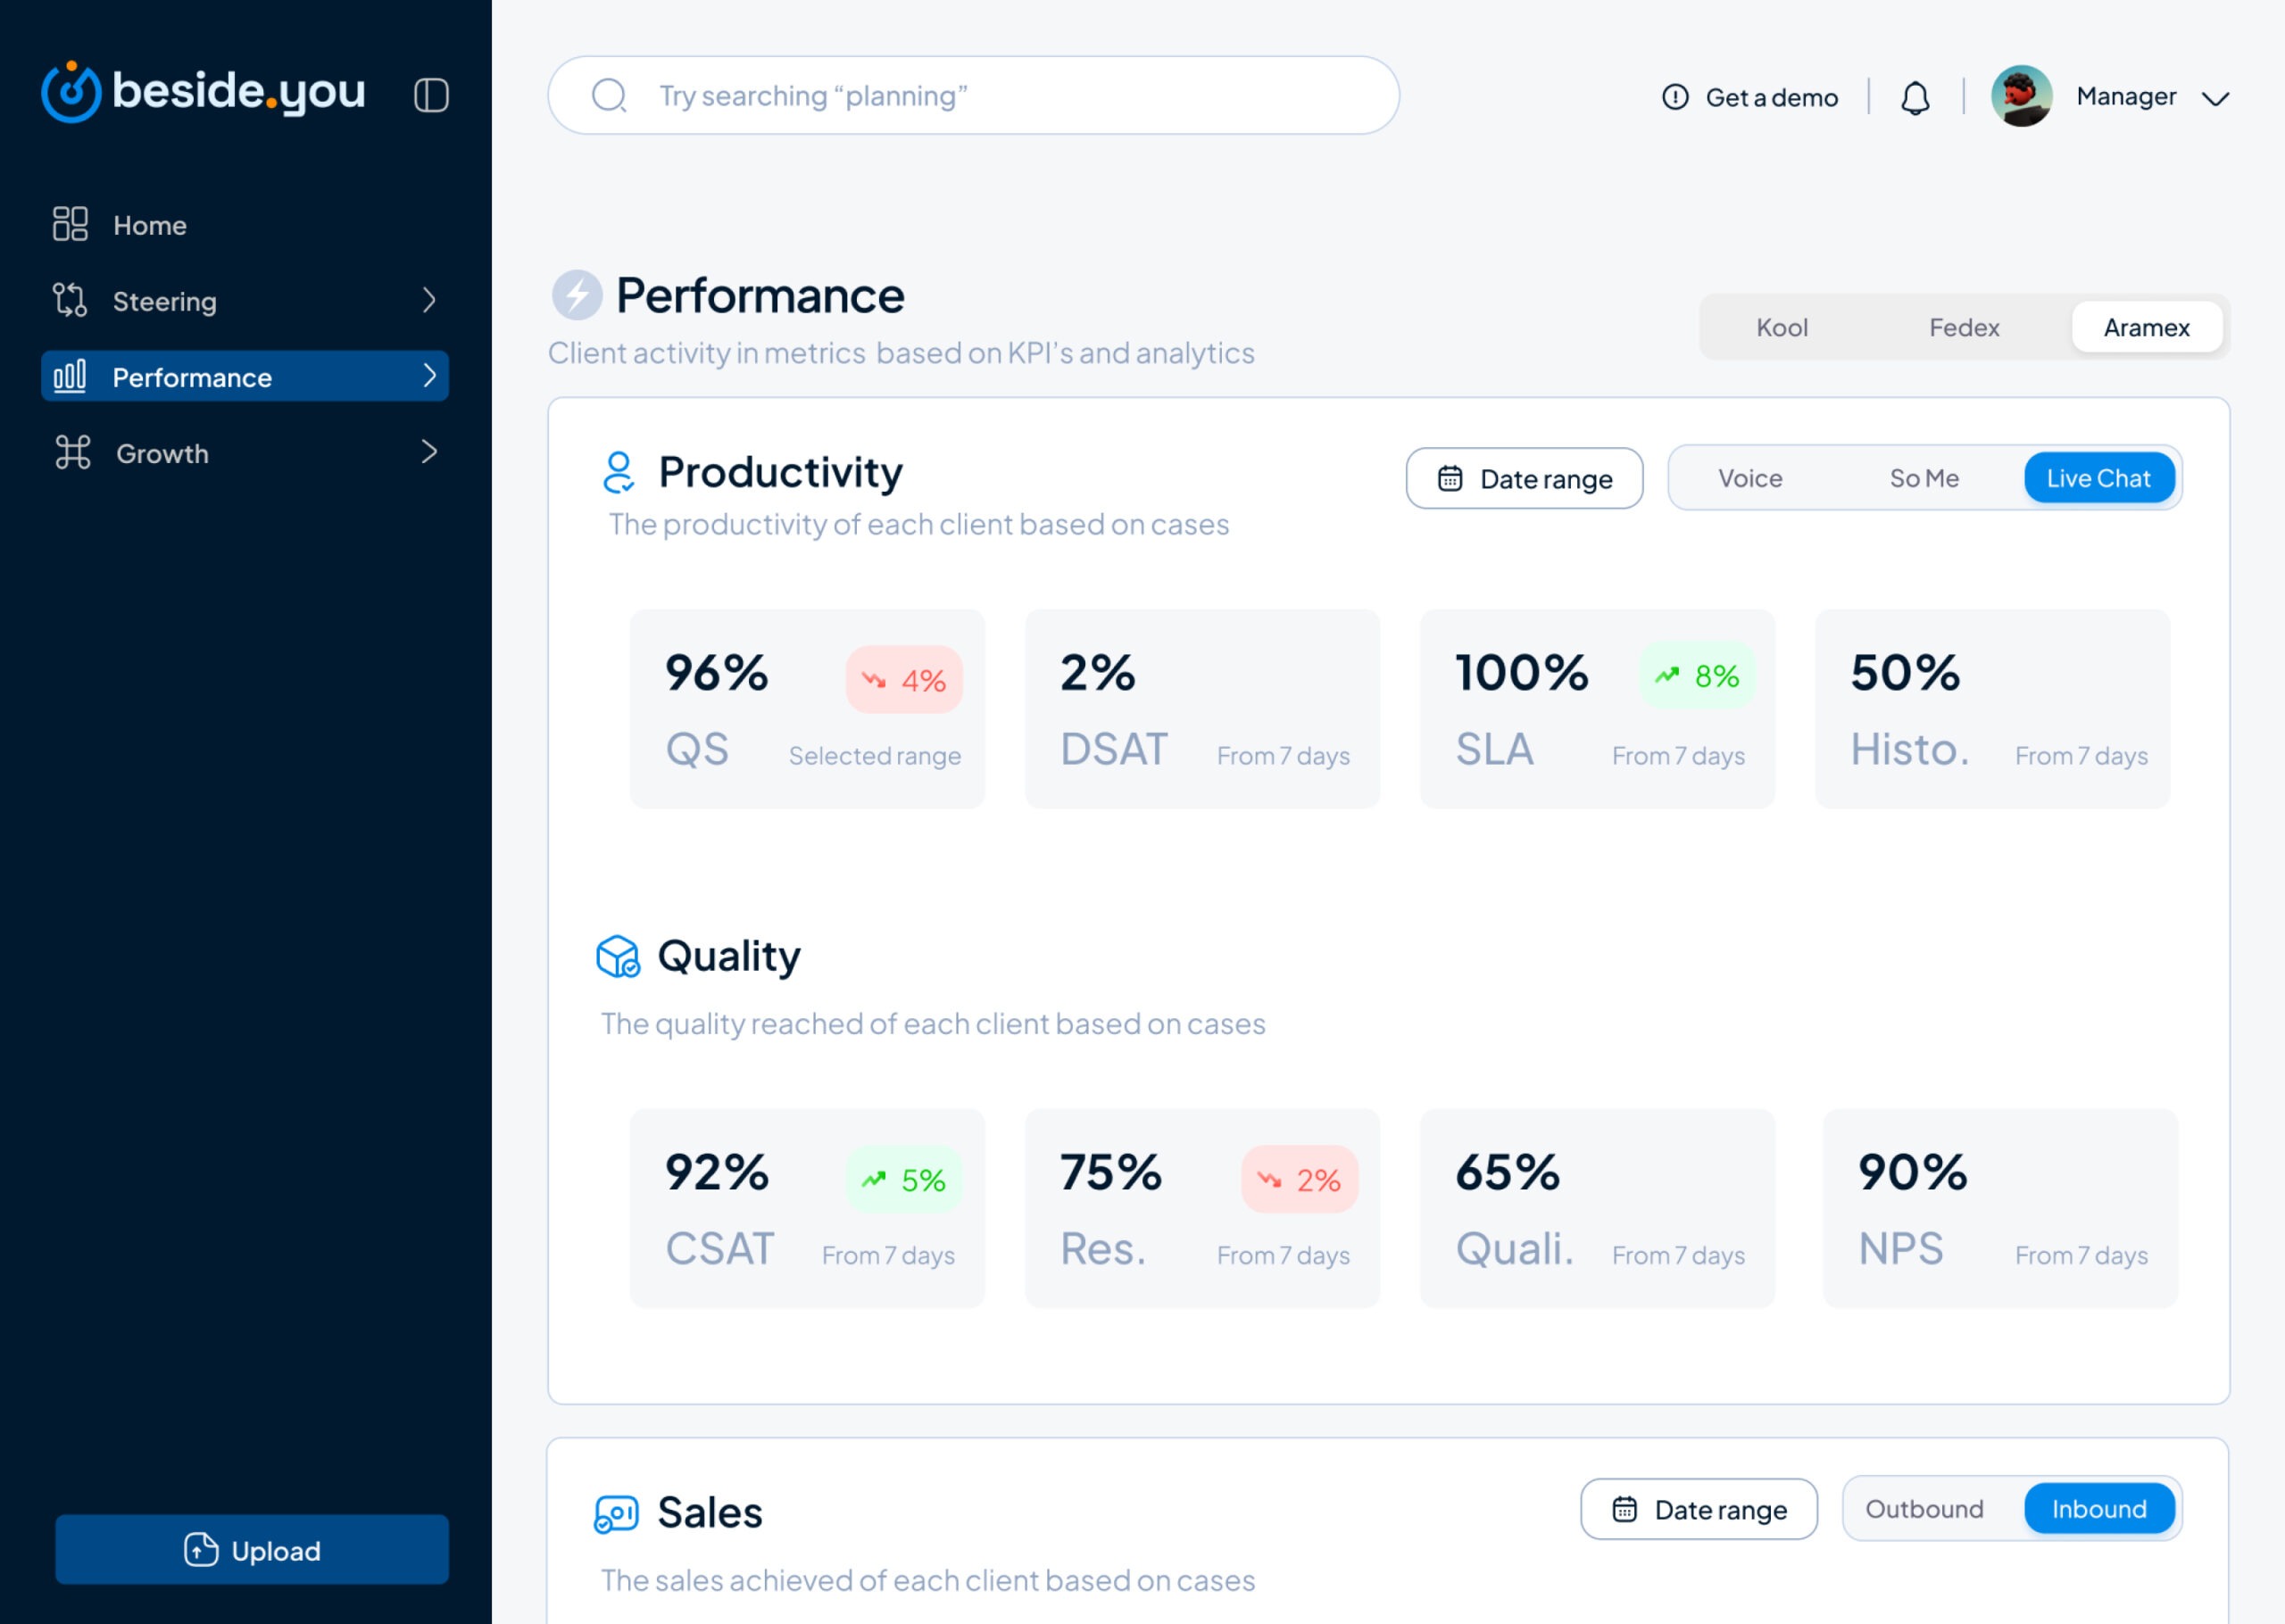
For performance, with many interfaces to switch to and from, I intended to keep transitions between data sets, clients, omnichannels, and sections as seamless as possible using intuitive elements such as tab switches, data cards, and a search bar.
Macro + Descriptive systems
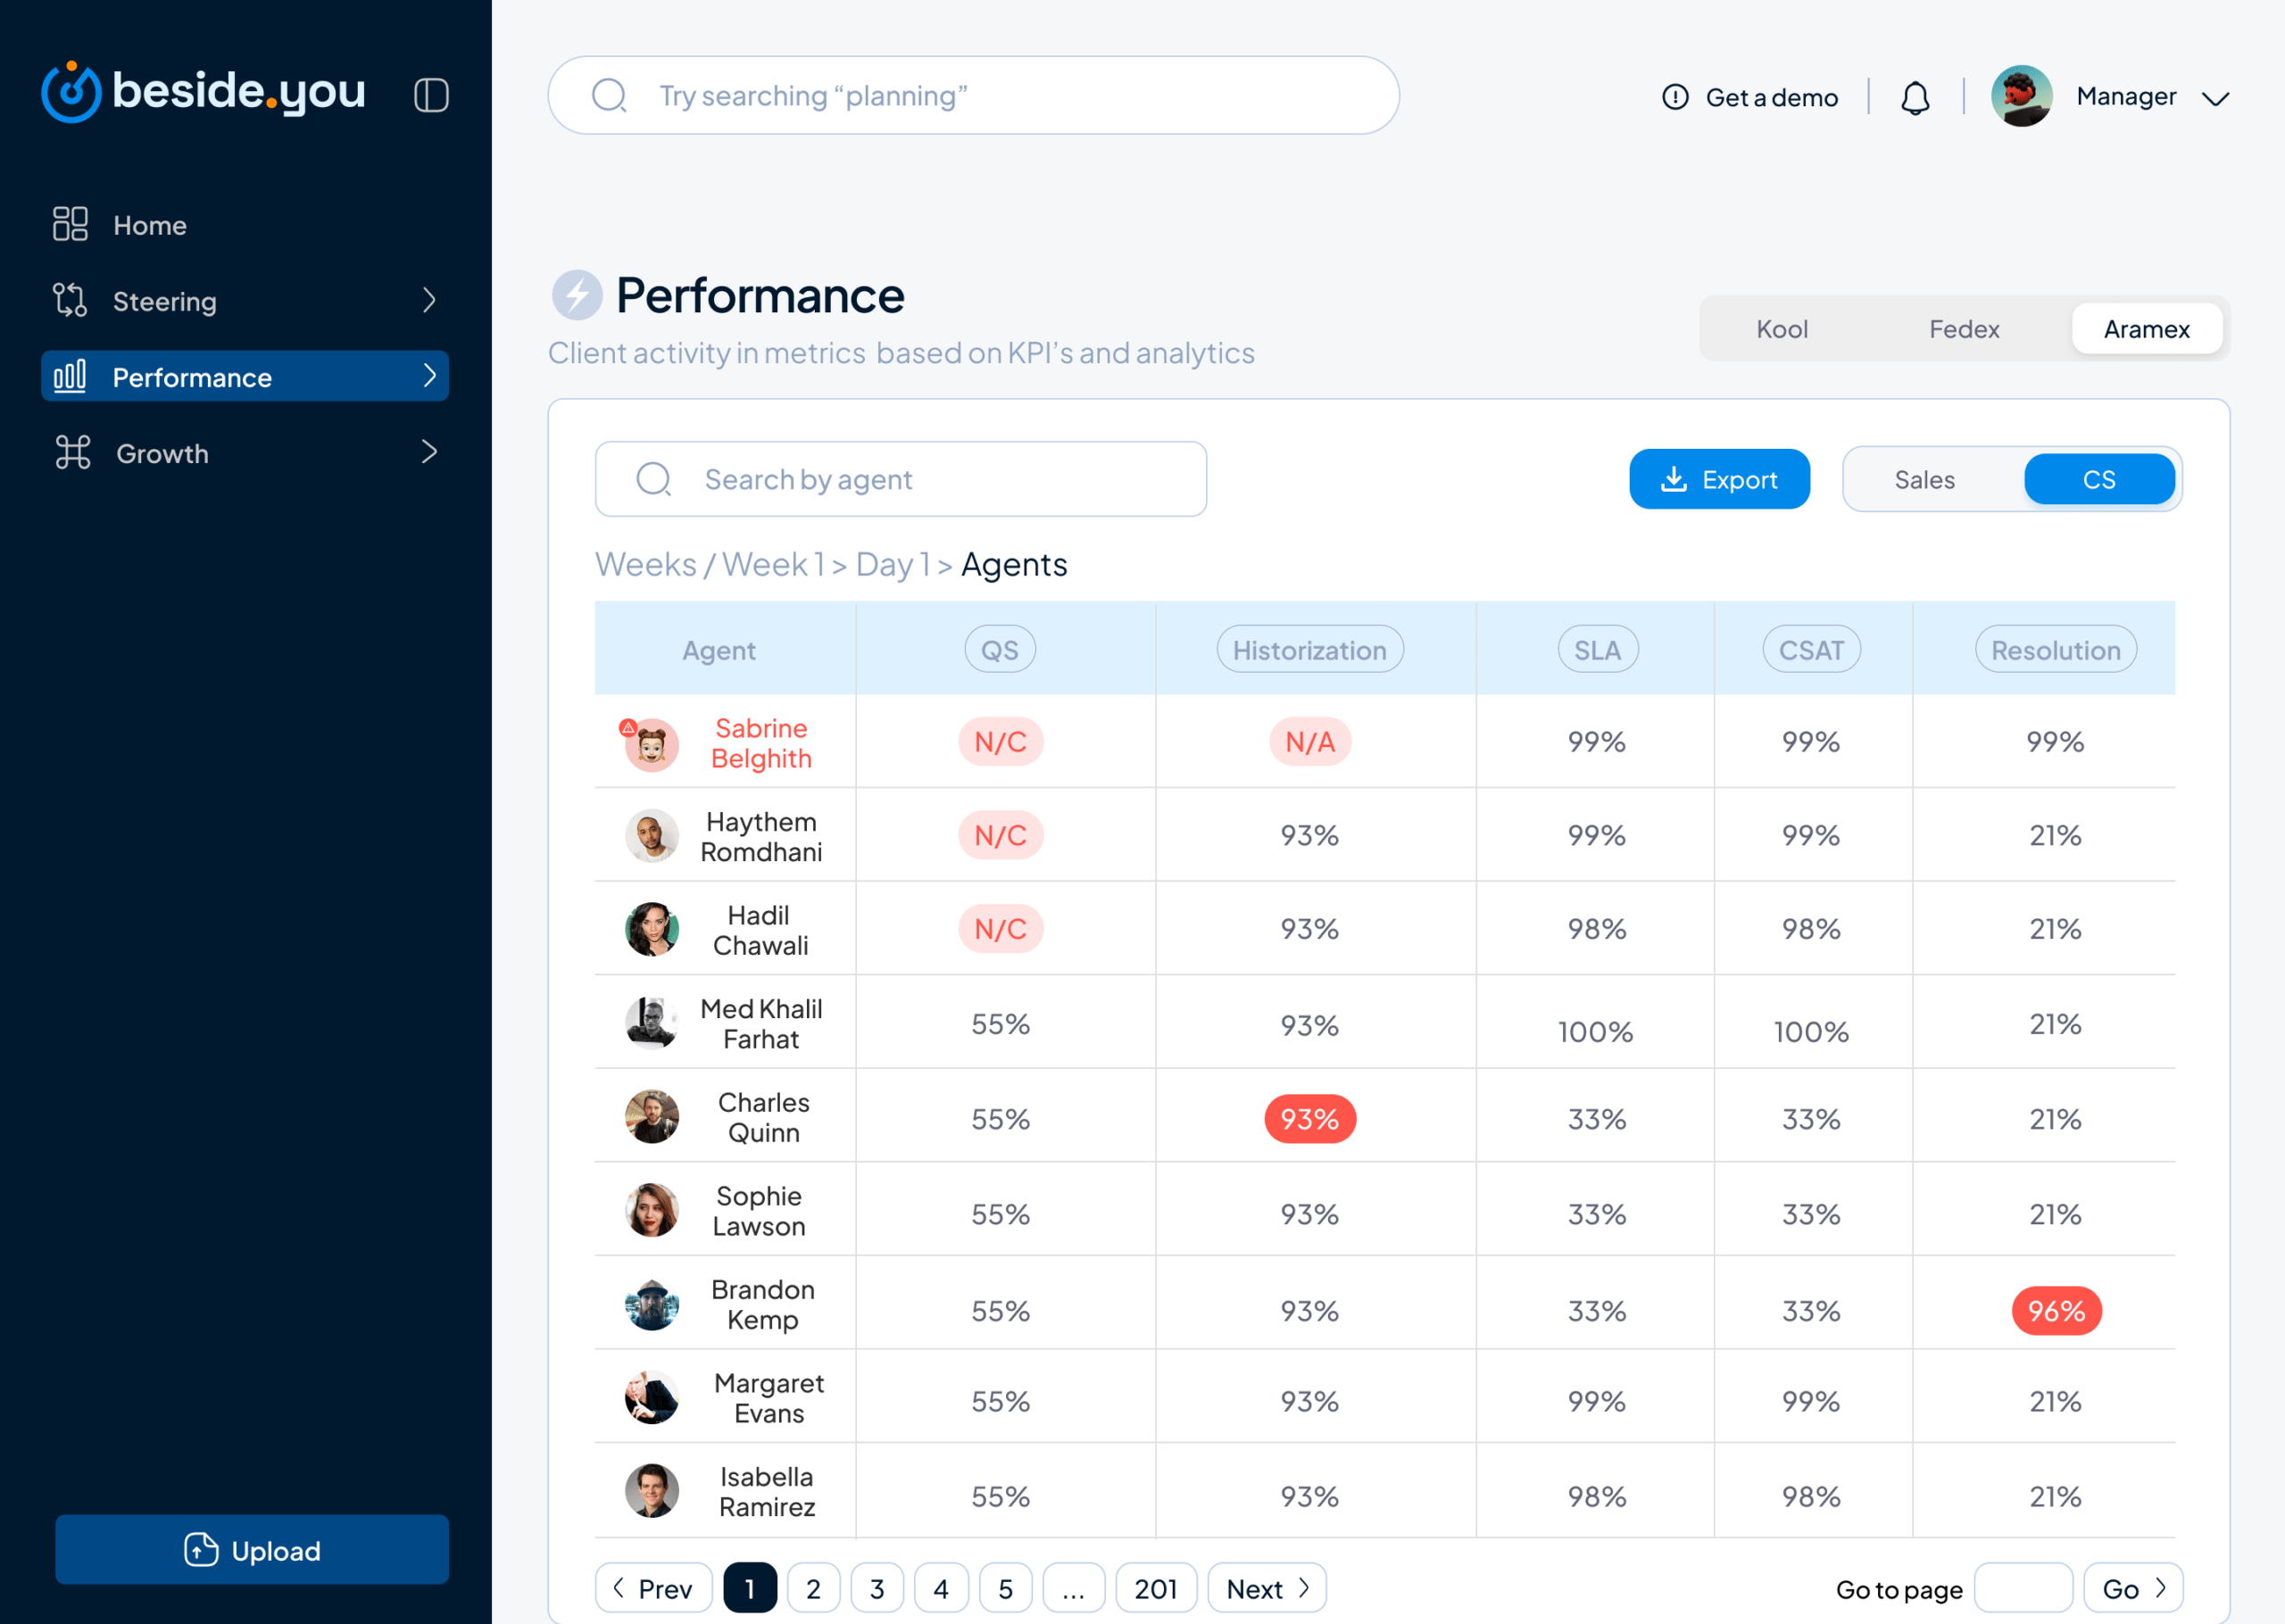
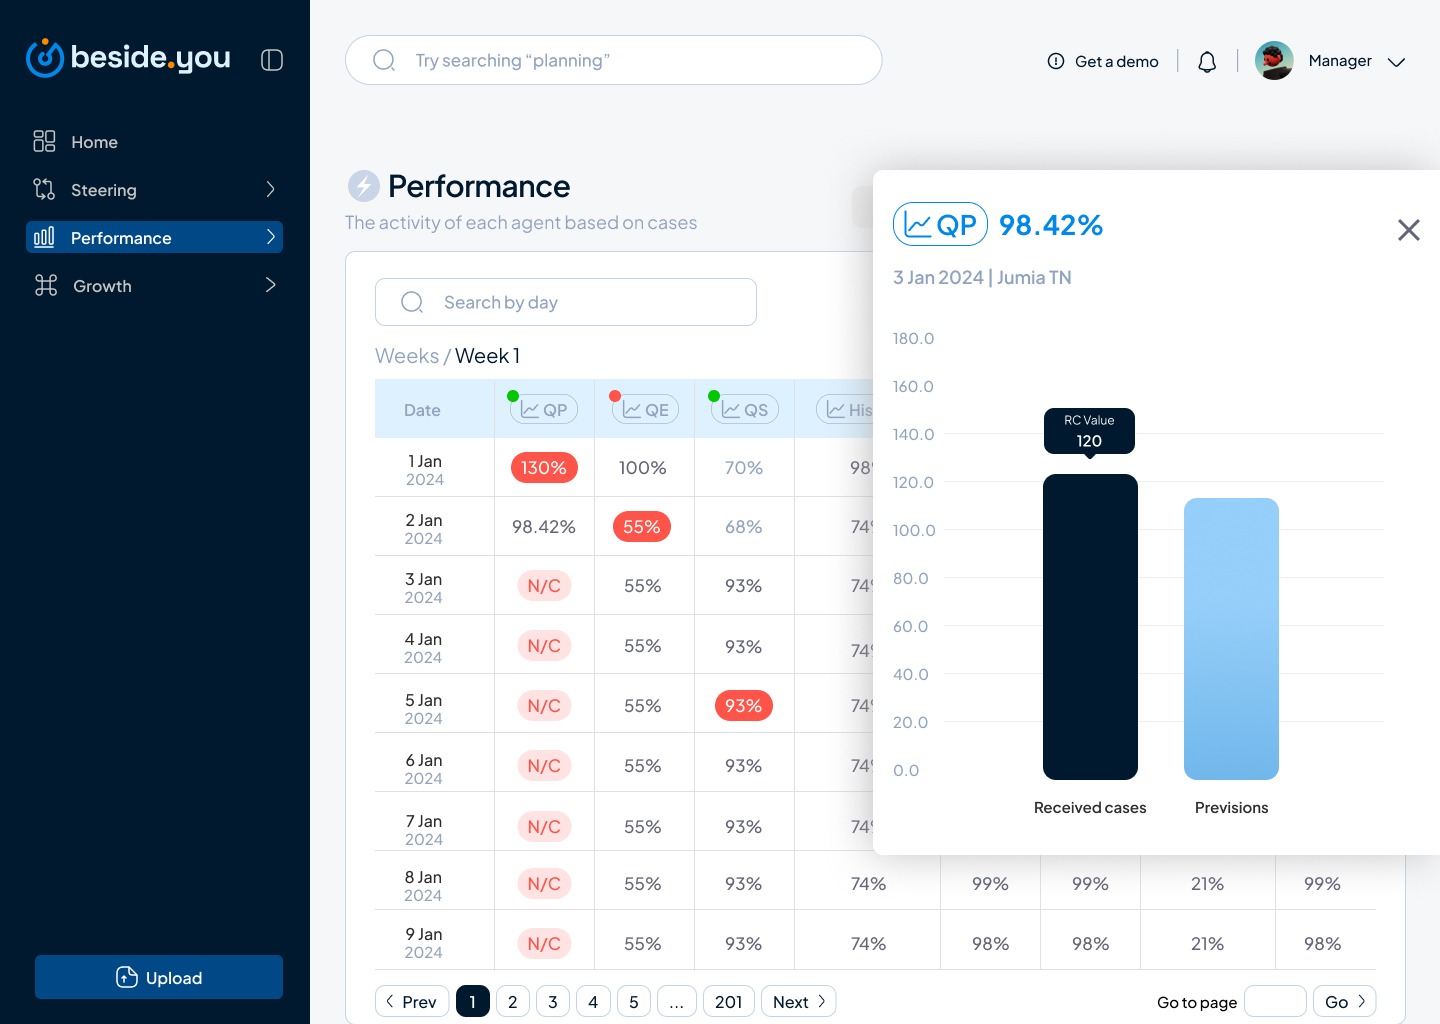
For performance, the more the user clicks on a table row, the more he delves into more insights on how each employee is performing based on the specified KPI’s; the more he zooms in, the more it gets descriptive.
Data upload and management
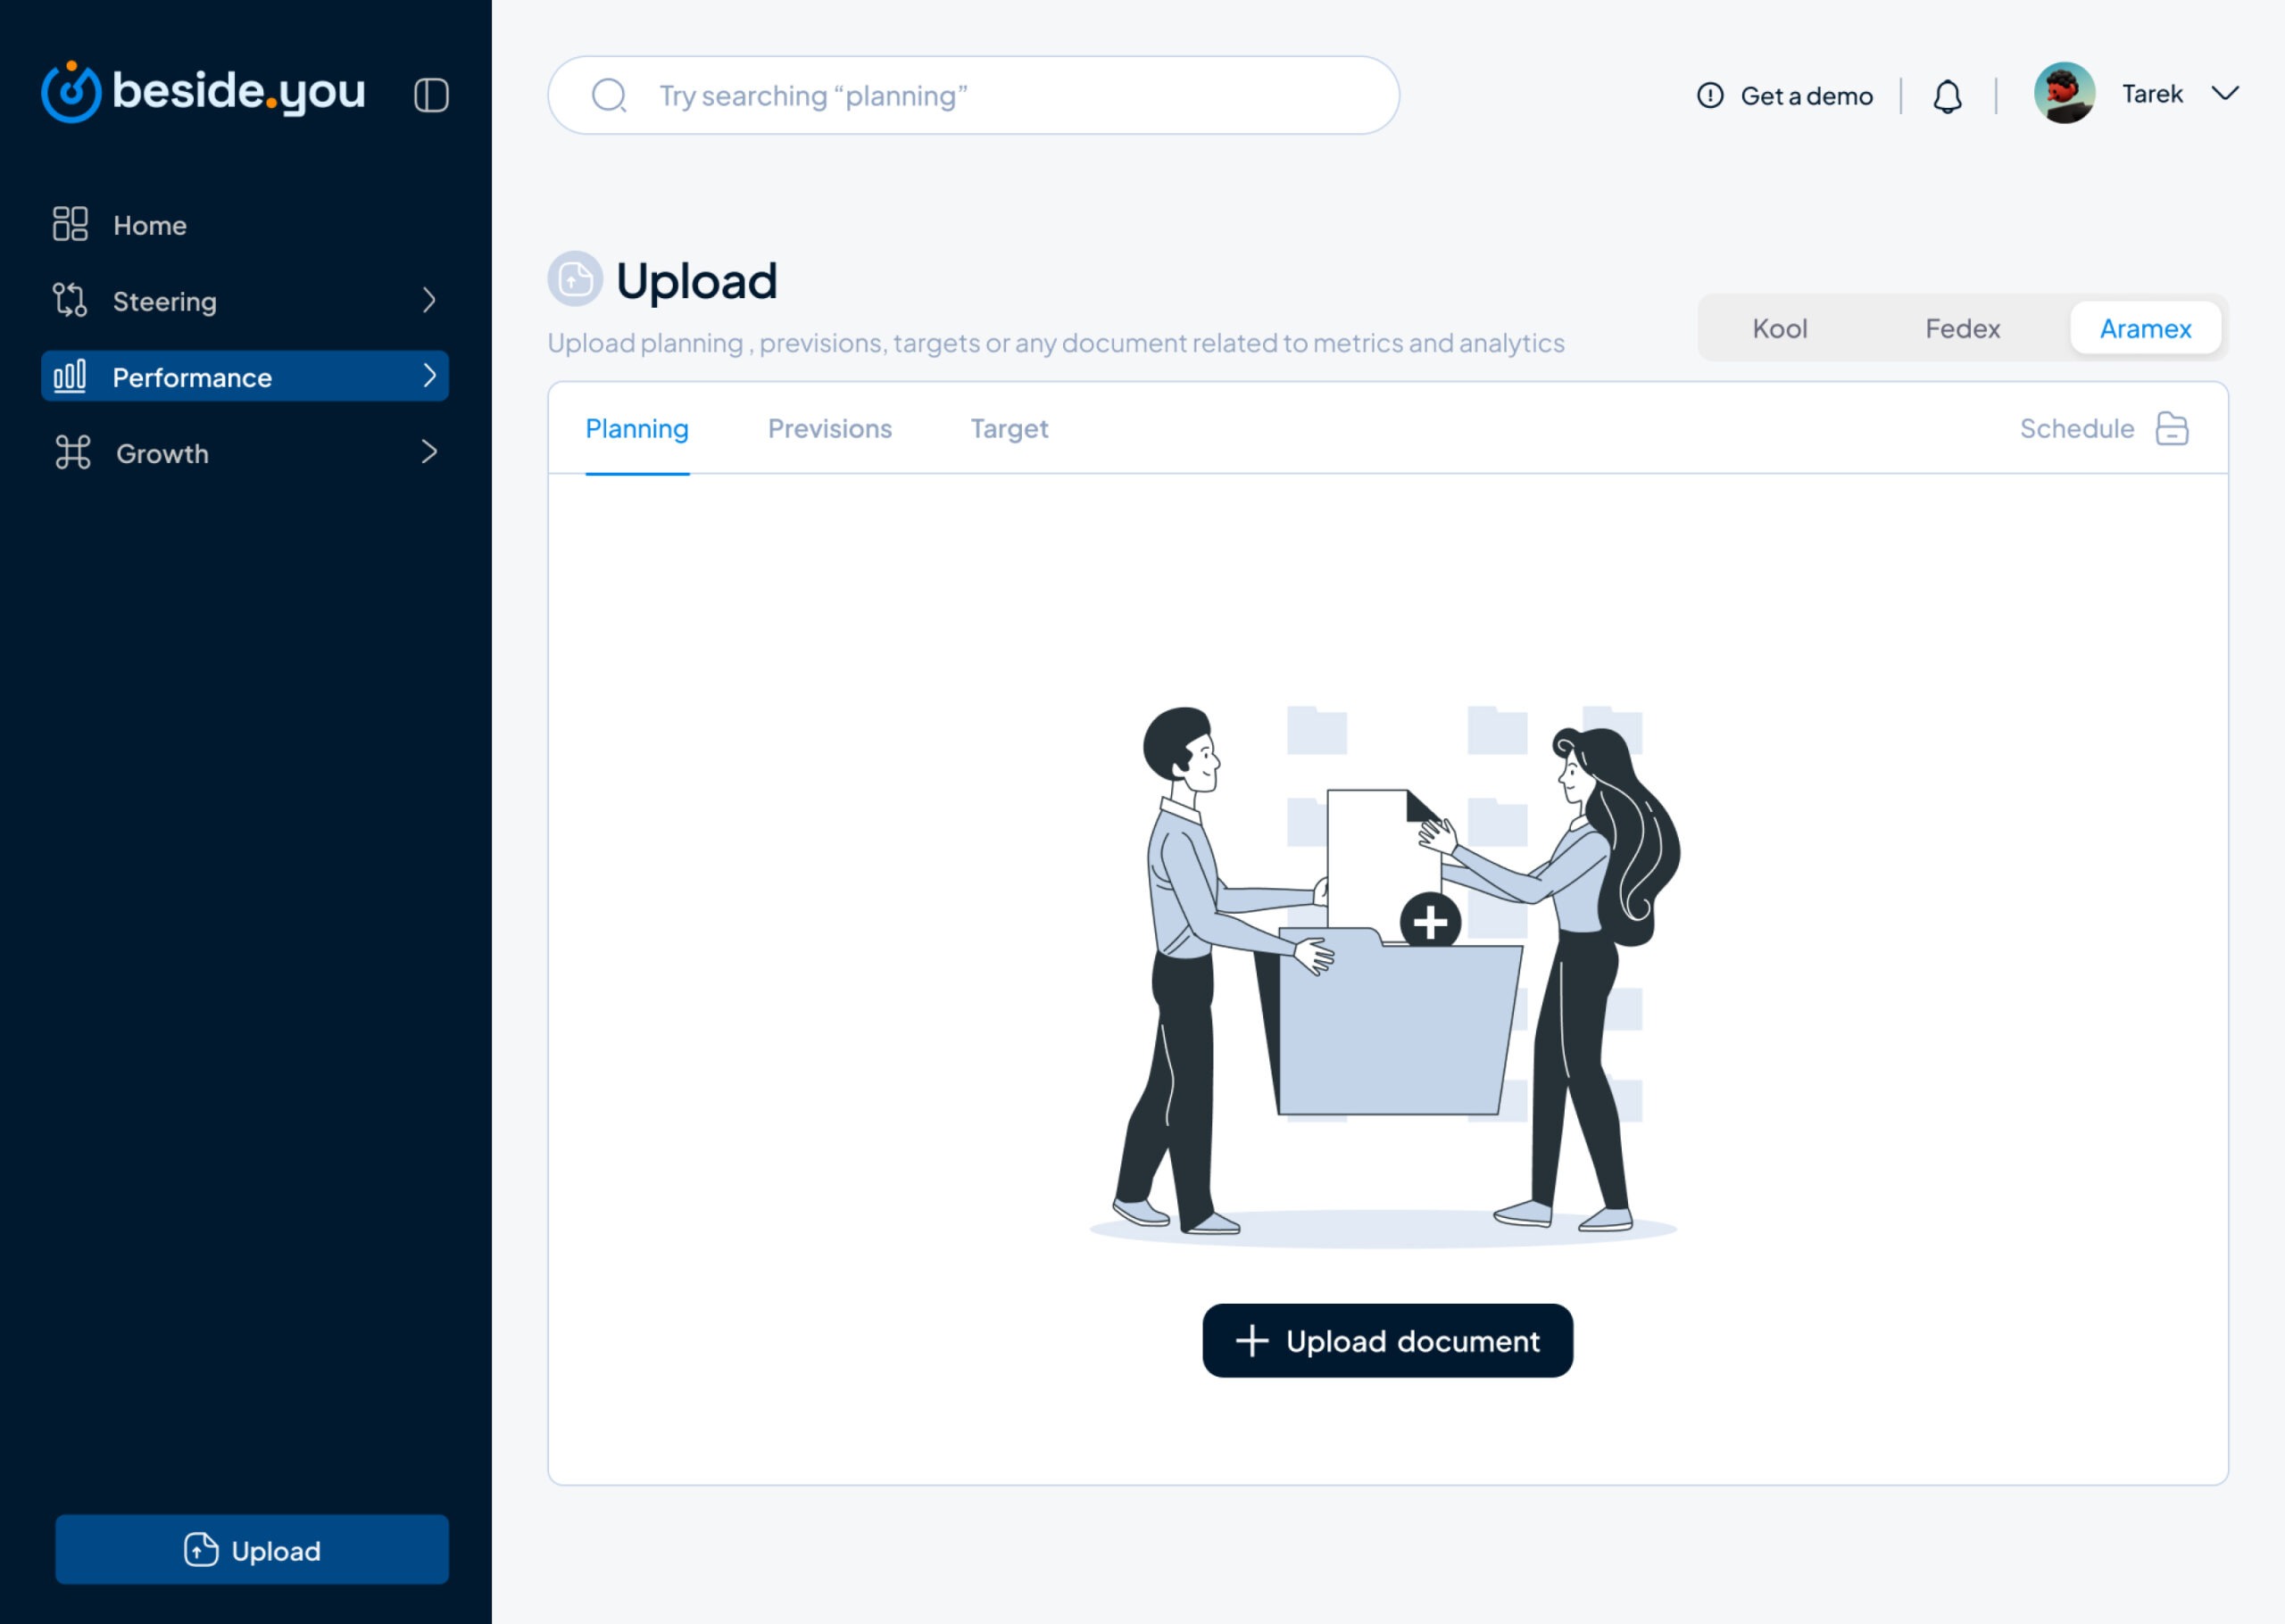
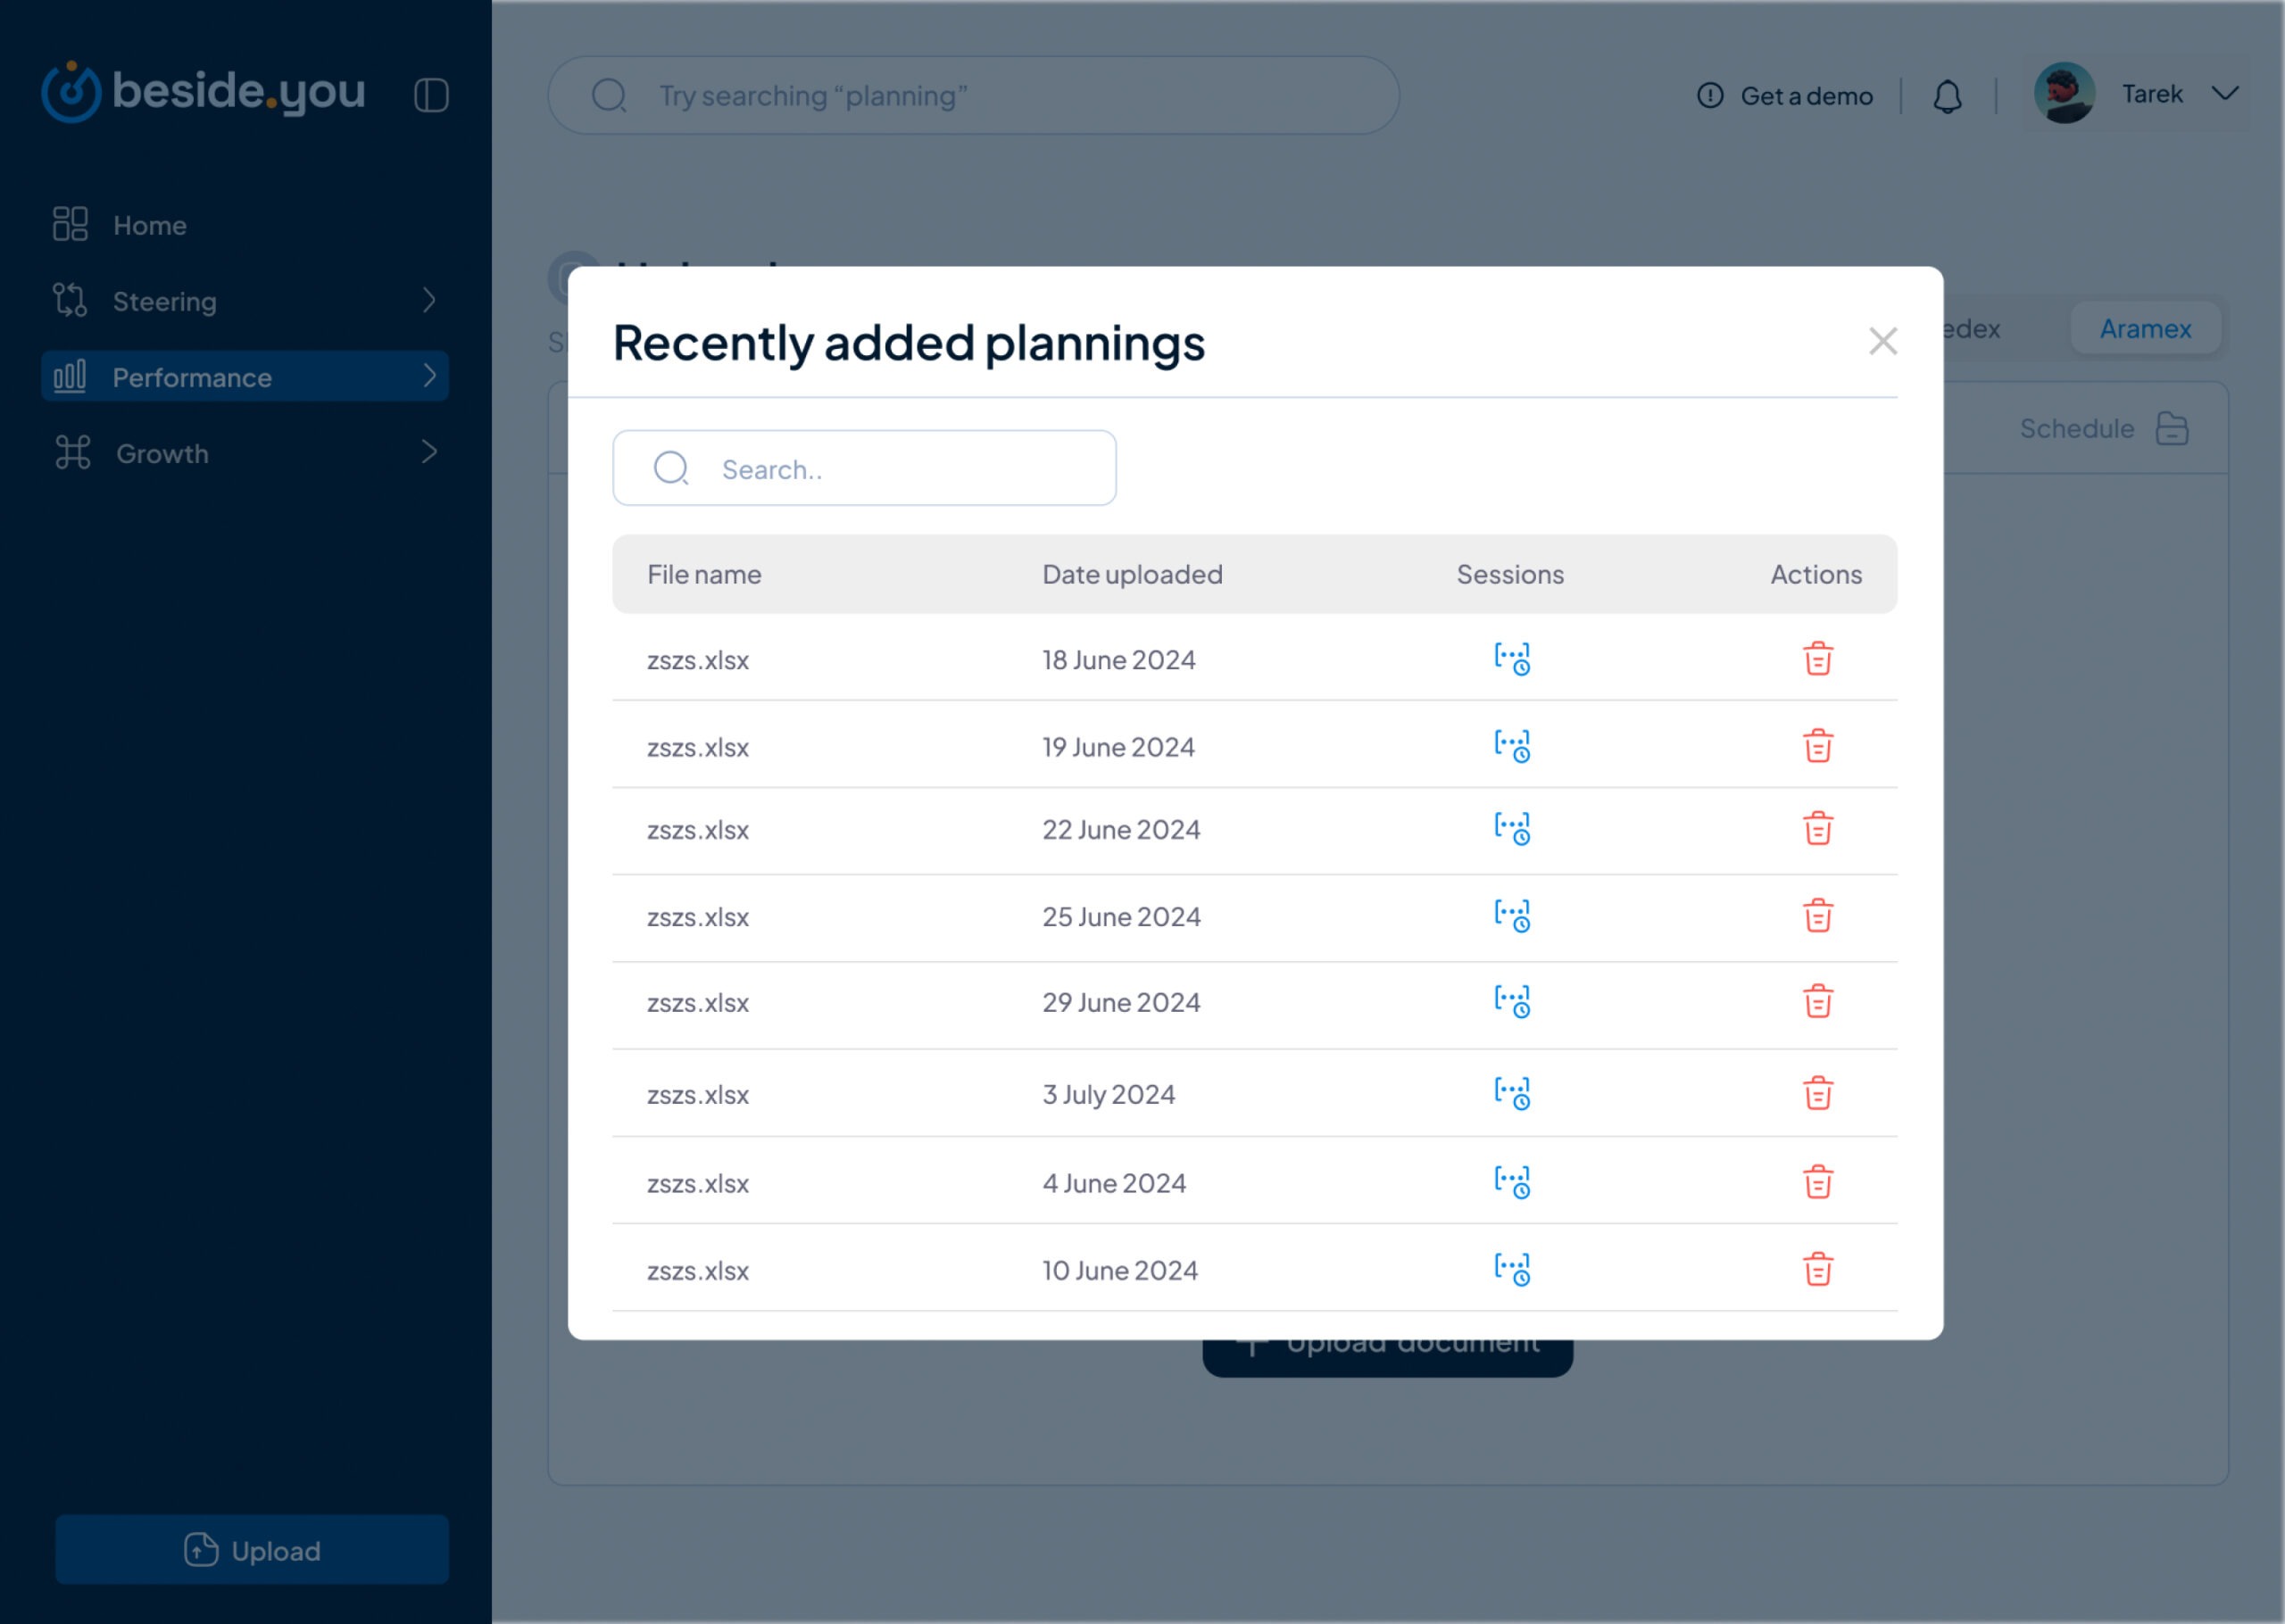
I intended to design the file upload interface with as much white space as possible to make it feel clean and free of any unnecessary elements that could cause cognitive load, letting the user focus on achieving the singular task of uploading and managing data.
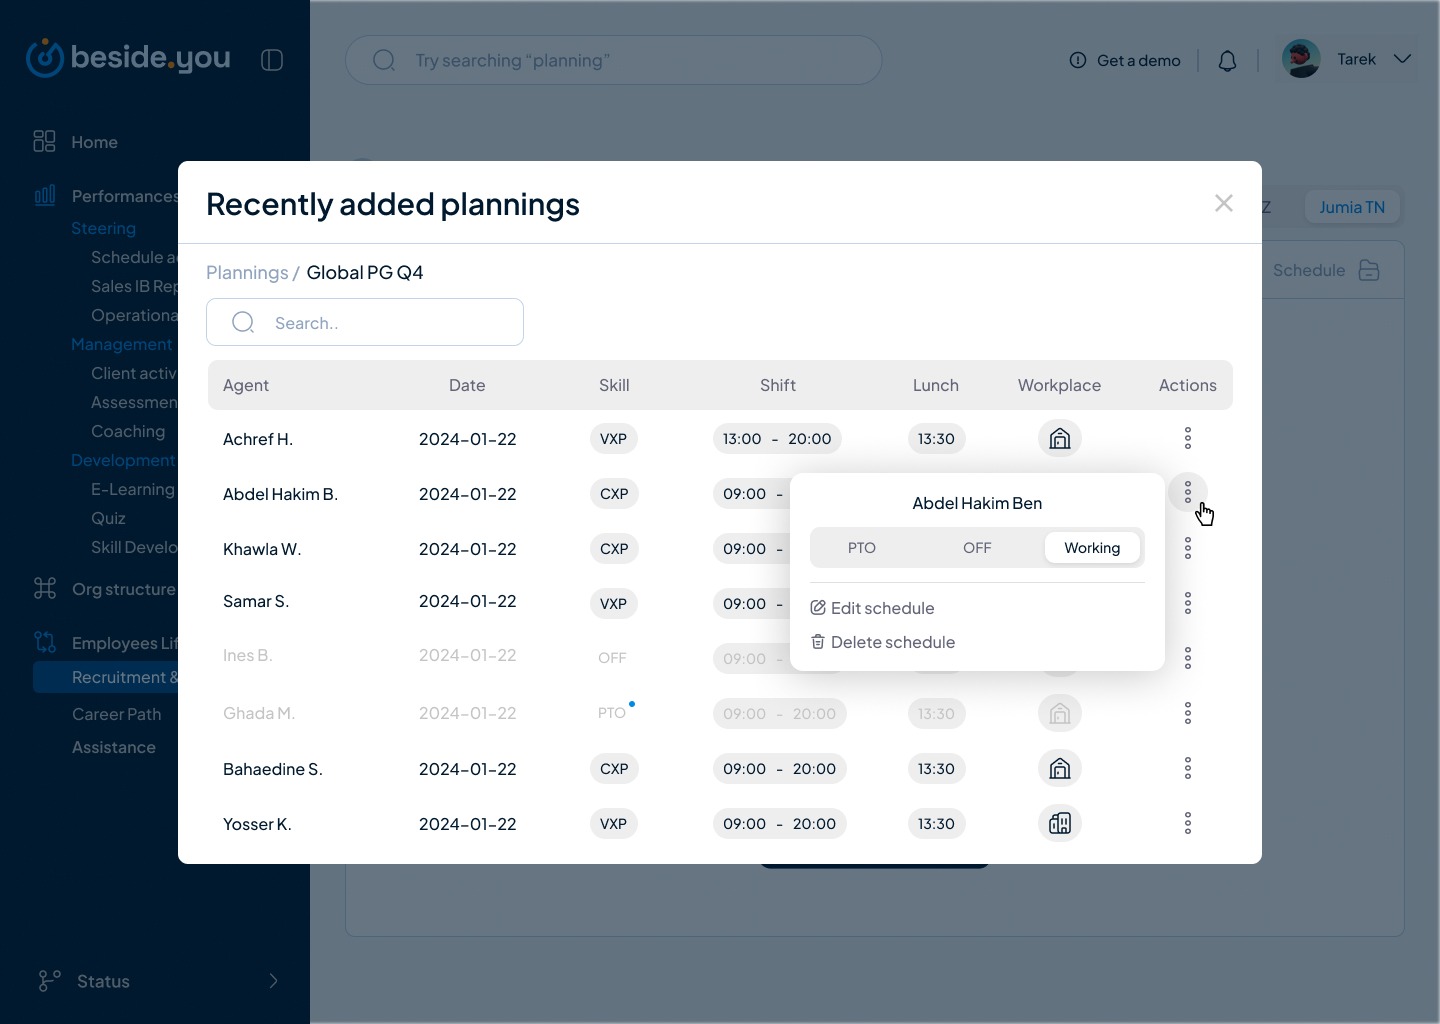
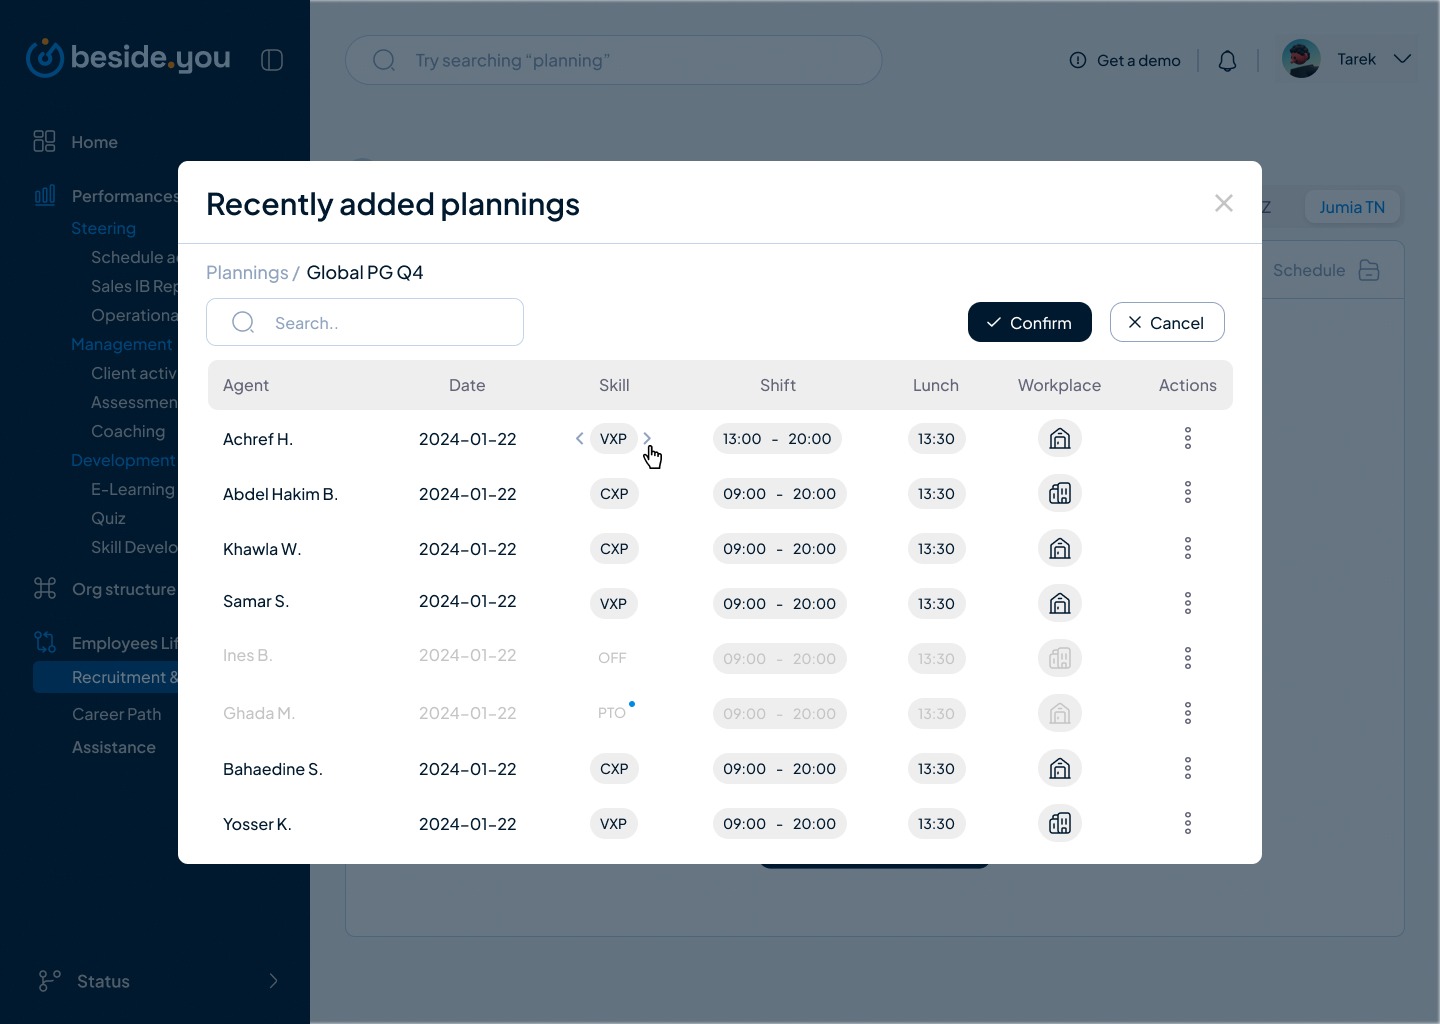
Automated scheduling
When the schedule file gets uploaded, the product will automate every data set and display it in a modal component that I designed. From there, schedule editing on every level could be achieved instead of the hideous task of editing the source file and having to upload it again and again.
Vision, Future Developments & Iterations
The next phase of the product journey will lay a new foundation for the ‘Predictive’ element of the whole structure so it will heavily focus on machine learning, data science, classification and AI
The SaaS aspect is getting tested with several clients while focusing on the next piece of the puzzle, the ‘Employee struggle’ and everything that will come with it.
The future developments include a variety of research processes and design iterations for the Growth, Performance and Steering which will eventually give birth to the new ‘Descriptive’ and ‘Prescriptive’ dynamic.
What I learned
As much as I can say that I gained so much knowledge in my craft, people and business I wouldn’t give it justice… the project is still ongoing with lots of potential and areas to improve. Still, as a small team we were and are proud of what we have accomplished so far, the team is now much bigger and still more to go.
As for myself, I’m “constantly” dissatisfied (in a good way) so I will always try to find new ways to iterate and hone my contribution to a project as much as I can however being the principal product designer within a small company that has huge ambitions, I took the responsibility of using everything in my arsenal to elevate the product strategy, user experience and the team to a level that I’m at least “satisfied” with (for now).